
Most rookie traders have the habit of using many indicators for analysis. “More is better,” they say. Sorry to burst your bubbles, but “more is better” will probably bring more confusion.
If you do not agree, don’t put up a fight yet. Just hear it out.
When setting up their initial trading screens, most newbies go along with the crowd, scooping up a stack of readymade indicators and cramming as many under the price bands of their preferred securities as possible.
This method short-circuits the production of trends because it simultaneously examines too many different aspects of the market. Ironically, indicators are most effective when they streamline analysis by sifting through distractions and producing actionable results related to trends, timing, and momentum.
Newbies should adopt a strategy of segmenting the kinds of information they wish to monitor throughout the trading day, week, and month.
Earn profit in 1 minute
What are technical indicators?
Traders estimate potential price fluctuations using technical indicators. By identifying probable exit and entry points, analyzing the previous trends, and projecting future price movements or direction, they support traders in making well-informed trading decisions.
They are developed using mathematical algorithms that account for past volumes, pricing, and interest in a commodity. Then, on market charts, these intricate algorithms are presented visually.
Almost all technical indicators fall into one of five groups. Each group is further separated into leading and lagging subcategories. While lagging indicators provide a historical account of the underlying circumstances that led to the current price’s position, leading indicators make predictions about where the price will go.
So, you can see how much burden you can create for yourself when you start with too many indicators. Well, if you are wondering what the best technical indicators are for a newbie to use, we have outlined three for you here.
You’re welcome!
Effective strategies in your mailbox
Subscribe and discover a fund of trading knowledge
Great! Please check your email
We’ve sent you an email to confirm your subscription
Something went wrong
Try reloading the page. If that doesn’t help, please try again later
1. 50-day and 200-day exponential moving averages
Moving averages examine the price movement in the past over set time frames, dividing the sum to get a consistent average that is adjusted with every new bar. Compared to their more well-known sibling, the SMAs (simple moving averages), the 50- and 200-day EMAs are more responsive. In essence, the 200-day indicator monitors the average long-term price of an asset, whereas the 50-day EMA reflects the average interval price.
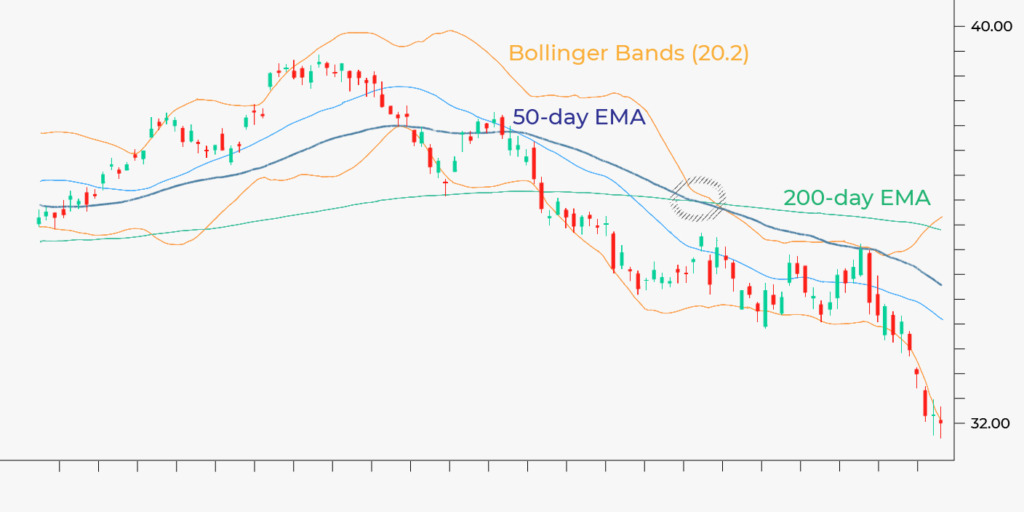
The 50-Day EMA and 200-Day EMA of the U.S. Oil Fund (USO) increased consistently over the 2014 summer as the asset advanced to a 9-month peak. In August, the 50-day EMA began to trend lower, and after a month, the 200-day did the same. The red circle represents the moment when the shorter-term average moved over the longer-term average, indicating a bearish shift in the trend that came before a momentous breakdown.
2. Bollinger bands
USO purchasing and selling impulses reach levels that appear to be buried, which prompts the onset of retracements or counterwaves. Bollinger bands attempt to spot these pivotal moments by calculating how far price might deviate from a pivot of the central tendency—in this case, the 20-day SMA—before initiating a reversionary impulsive move to the mean.
Trading with up to 90% profit
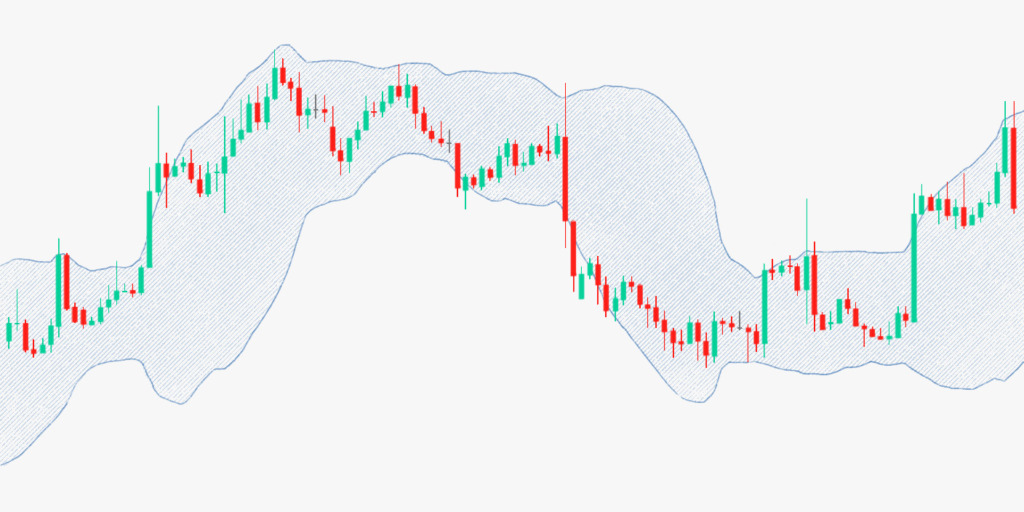
Also, the bands react to changes in volatility by contracting and expanding, which alerts traders when this unseen force no longer stands in the way of quick price action.
5 of the best scalping indicators to use right away
You can experiment with various indicators, but there are some you can use right away to build your best scalping strategy.
Read more

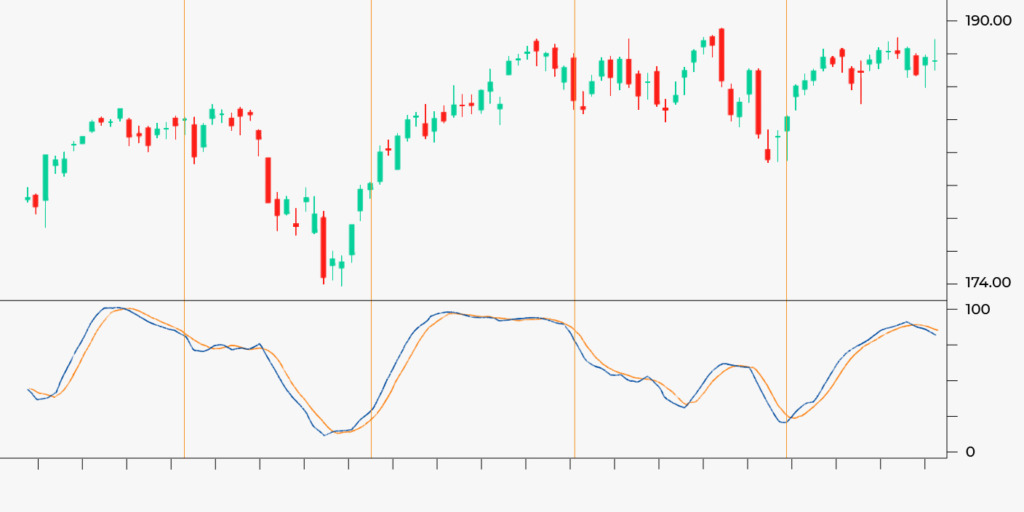
3. Stochastics
Buy-and-sell loops shape how the market moves, and relative strength indicators and stochastics (14,7,3) are used to identify these movements. Usually, these loops climax at oversold or overbought levels before reversing course, with both indicator bands crossing over. Contrary to what you may predict, cycle alterations do not often result in an increase or decrease in asset price. Bearish or bullish turns, rather, denote times when sellers or buyers are in charge of the ticker tapes. The price change is still influenced by market variables such as momentum, volume, and others.
Conclusion
It might not be easy to choose the proper technical indicators. Still, it is achievable if new traders concentrate on the benefits of the five market analysis types of trend, relative strength, mean reversion, volume, and momentum. They can start the time-consuming but rewarding process of adjusting parameters to suit their trading techniques and risk tolerance once they have included useful indicators for each area.
Start from $10, earn to $1000
<span>Like</span>