
Although trading tools develop, more guides are published, and more types of information are used to explain how to use technical analysis, traders keep making the same age-old mistakes. Below, you will find old technical analysis problems that are relevant for traders of all generations.
Start from $10, earn to $1000
1. New markets – old tools
If you read the history of indicators and patterns traders use, you will be surprised how many years, and even centuries ago, they were developed. Can you imagine that the candlestick chart all traders use today originates from the 1700s? The chart system was developed based on a link between rice’s supply, demand, and price.
Nowadays, there are many more assets you can trade besides rice, including Forex, commodities, equities, bonds, and cryptocurrencies. Can the same rules apply to all of the assets you can trade?
How to overcome the problem?
It doesn’t mean you should use only new tools developed for the cryptocurrency market, for instance. There is a risk, as new indicators haven’t proved their reliability. However, you should test the old indicator and patterns on a demo account or historical data to be sure they react to the price fluctuations appropriately.
Effective strategies in your mailbox
Subscribe and discover a fund of trading knowledge
Great! Please check your email
We’ve sent you an email to confirm your subscription
Something went wrong
Try reloading the page. If that doesn’t help, please try again later
2. Perfect tools

When beginner traders read guides on how to trade, what indicators to use, and what patterns can help them predict a price direction, they see perfect pictures of how patterns and indicators look and how a price immediately reacts to their signals. Tutorials mention only standard tool applications that work on most timeframes for most assets.
You should remember that there is a huge difference between daily and monthly timeframes. There is even a difference between 15-minute and 4-hour periods.
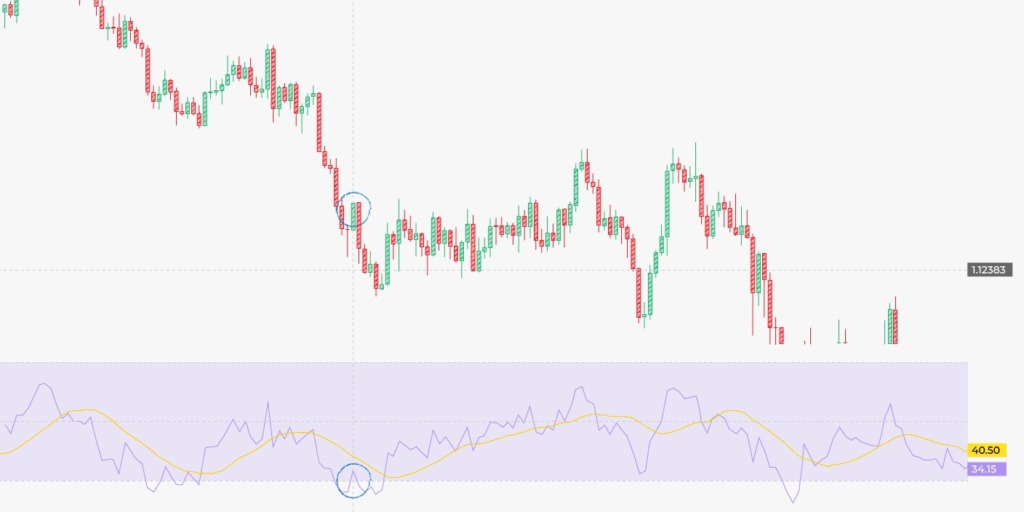
For example, the rule of the RSI indicator says to buy when the index leaves the oversold zone (30 level). Sounds simple. However, if you look at the chart below, you will see that the index left the oversold zone but returned to it the next day. Thus, the fall continued for another four days.
Patterns also aren’t perfect. They usually look different from what you see in a tutorial and can provide fake signals even though it seems they are correct. Look at the examples below.
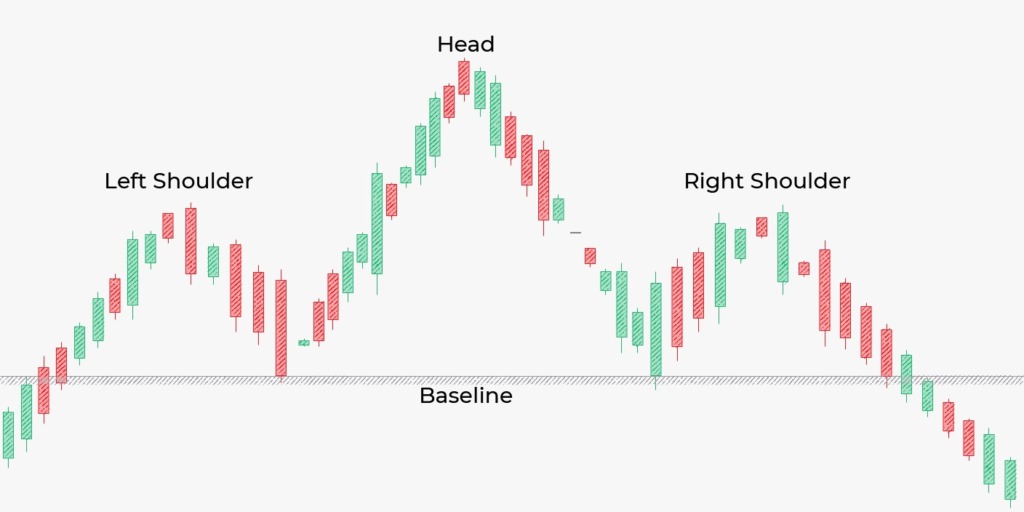
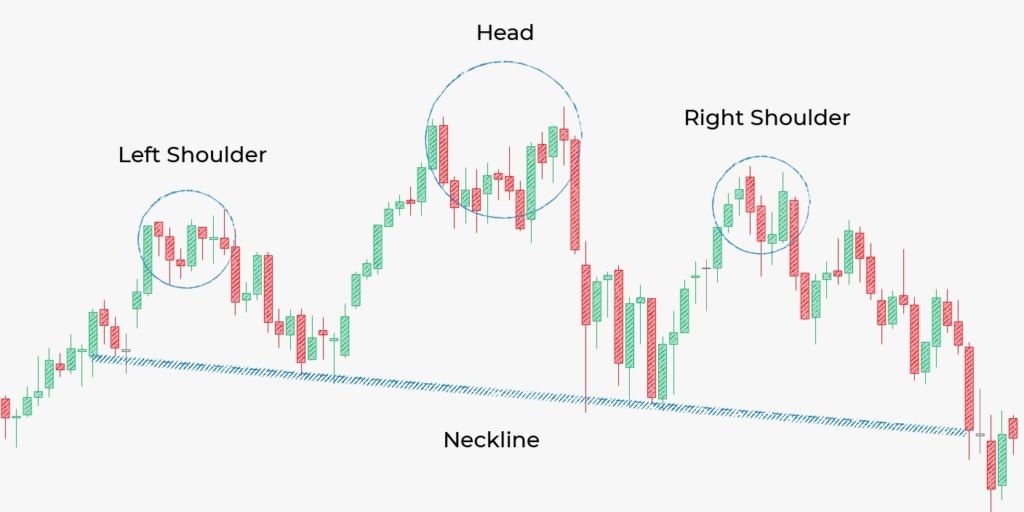
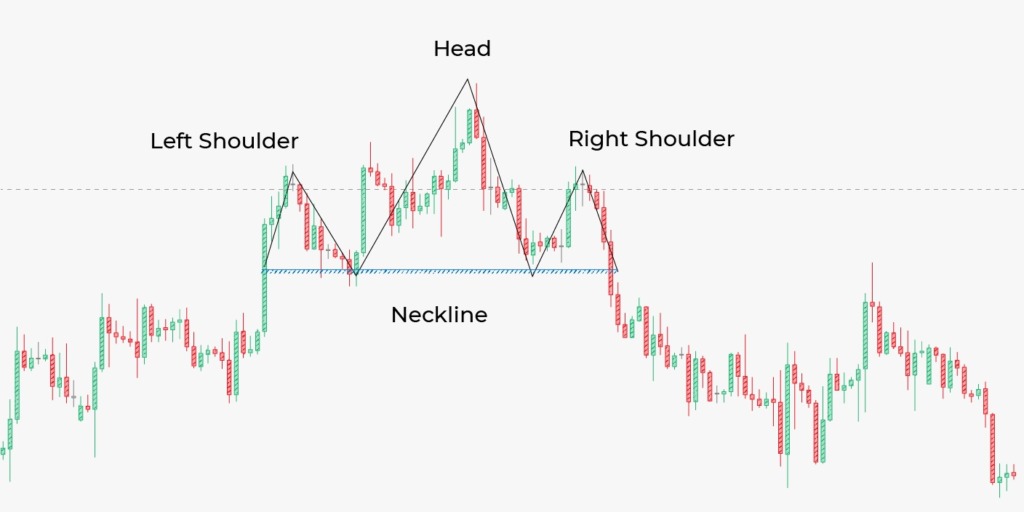
The first picture shows a perfect head-and-shoulders pattern mentioned in a tutorial. In the second picture, there is a real pattern you can find on a price chart. Moreover, it’s not the only interpretation of this pattern. You can find something like this:
How to overcome the problem?
Every trader must remember that there is nothing perfect in this world. You will never find those ideal conditions mentioned in the book. To set the indicator properly for the asset you trade and on the timeframe you prefer, test the indicator on historical data at least five times. Try to find patterns in historical data and check whether they worked.
Top 5 sitting postures for traders
Many traders think less about their sitting postures, negatively impacting their health. Check it out!
Read more

3. Technical analysis is not a hard rule
Many traders choose technical analysis over fundamental because the fundamental approach seems less predictable. Newbies believe it’s enough to learn the key patterns and indicators mentioned in all tutorials, and they will open perfect trades. However, technical analysis is very subjective and depends on numerous factors, including the amount of funds you put in, the asset you trade, your goal, your skills, your emotions, etc.
Moreover, the indicator doesn’t provide 100% accurate signals. Fundamental events will always affect price movements.
How to overcome the problem?
Don’t assume that technical analysis is foolproof. There is no perfect method that will bring rewards 100% of the time. You must develop your own trading system. It will take time until you find indicators and set them the way they provide accurate signals. Besides technical analysis, listen to yourself and don’t go against your opinion.
Summing up
Technical analysis problems are rampant, no matter how much educational material exists. The mistakes that traders make repeat over the years. However, you can always turn weaknesses into strengths.
Earn profit in 1 minute
<span>Like</span>