
The best feature of technical analysis is that it can be applied to almost any asset. Traditional chart patterns, technical indicators, and tools are effective on Forex, cryptocurrency, and stock markets. Therefore, if you learn some approaches, you can apply them to any asset you trade.
There is a well-known term, “trapped traders.” It describes traders who open trades on weak signals, without signals, or without confirmation. In order to not be a trapped trader, you should examine some of the best price action strategies.
Start from $10, earn to $1000
1. Pin bar trading strategy
It’s one of the advanced price action strategies. A pin bar is a candlestick with a small body and long shadow. It usually appears before the price turns around. If a candle has a long lower shadow and occurs at the end of a bearish trend, it signals the price will turn up soon. If a candlestick has a long upper shadow and appears at the end of a bullish trend, it’s a sign the price will turn down soon.

Look at the chart below. The price formed a bearish price bar (1) at a strong resistance level. However, if you check the Volume indicator, you will see high bull volume (2). Therefore, you need additional confirmation to enter the market. Wait for the price to form a bearish candlestick after the pin bar. If the second candlestick is bearish, you can enter the market right after it. Place a stop-loss order at the resistance level if market volatility is low and above the pin bar’s high if volatility is high.
As for a take-profit target, you can trail it to limit risks and increase potential income. Place it at the points where the price rebounded last time.
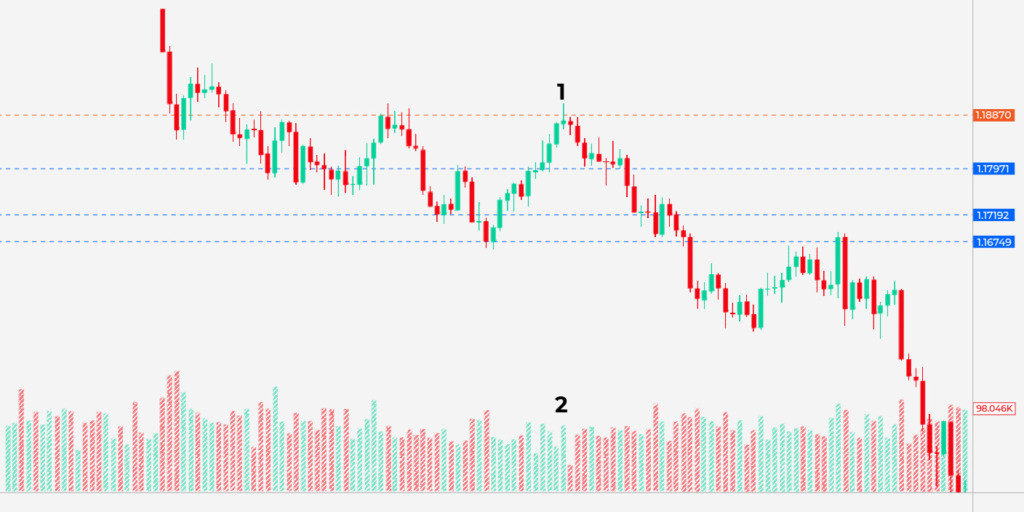
You should remember that pin bar candles can form with no price reversal after them. Therefore, you should always confirm signals and place stop-loss orders.
Effective strategies in your mailbox
Subscribe and discover a fund of trading knowledge
Great! Please check your email
We’ve sent you an email to confirm your subscription
Something went wrong
Try reloading the page. If that doesn’t help, please try again later
2. Trend trading: keep the position for the long term
Price action is about trends. When a price forms higher highs and higher lows, it’s an uptrend. Vice versa, a price goes down with lower highs and lower lows in a downtrend. It’s easier to identify a solid trend on high timeframes, starting from H4.
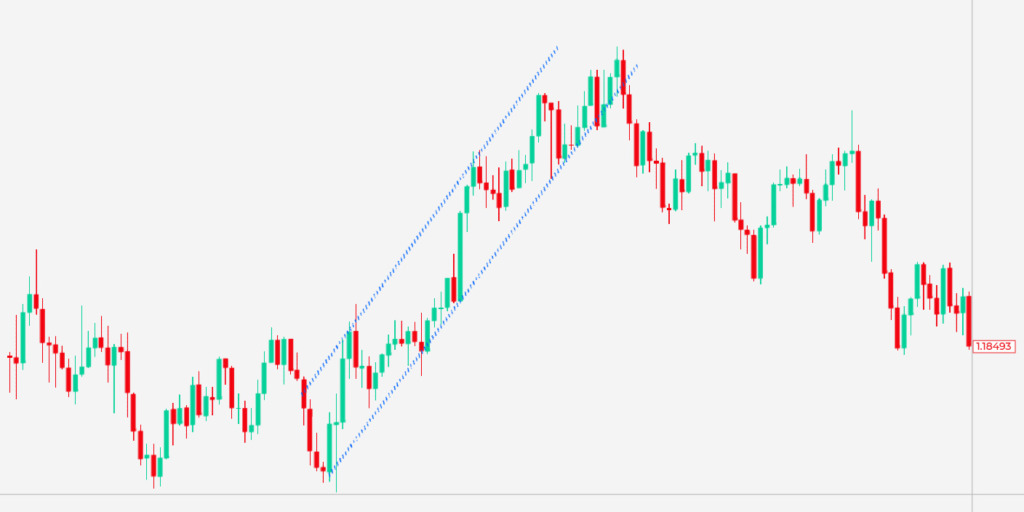
It’s a long-term strategy. The idea is to enter a strong trend and keep your trade open until there are signals the market has reversed.
To shape a trend, you need to draw trend lines through at least two points. Buy at a lower trendline and keep the trade open in a bullish trend. Sell at an upper trendline and keep the trade open in a bearish trend. A trend reversal can be confirmed with the price breaking below the key trendline (1). A break means a price closure beyond the line and following movement in the breakout direction.
3. Trend trading: trade on rebounds
Another strategy is also about the trend. The idea is to open several trades within a solid trend. Trendlines serve as support and resistance levels. Therefore, you can buy at the lower line with a take-profit target at the upper line and sell at the upper line with a take-profit order at the lower line. A stop-loss limit should be some points below the entry point.
5 of the best scalping indicators to use right away
You can experiment with various indicators, but there are some you can use right away to build your best scalping strategy.
Read more

4. Pattern strategy
A price forms different shapes that remind traders of well-known things, for instance, a double top and bottom, cup and handle, triangle, wedge, head and shoulders, etc. Patterns have established rules of where to enter and exit the market. Therefore, they are widely used by traders worldwide.
Earn profit in 1 minute
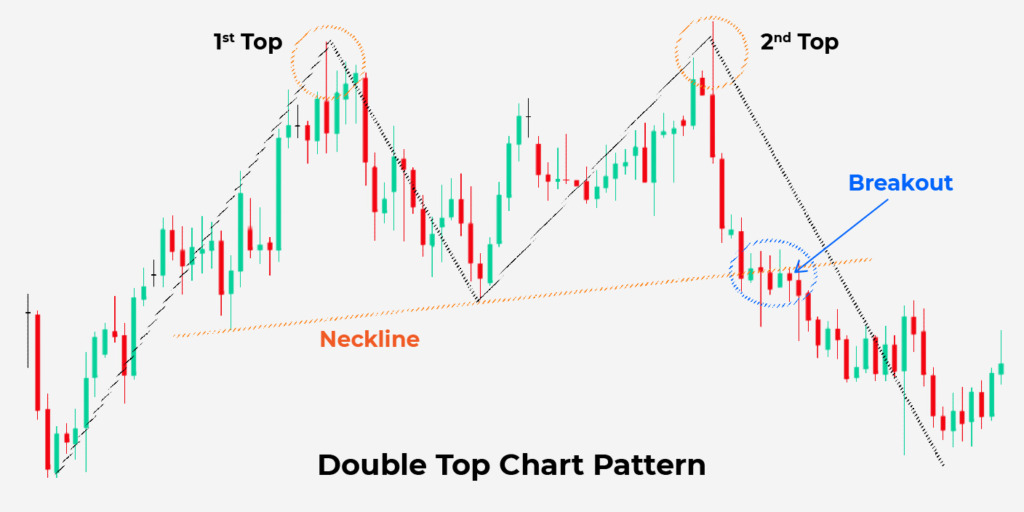
A double-top pattern is one of the most popular Forex price action strategies. It appears at the end of a bullish trend and predicts a price reversal. The price should form two peaks. They don’t have to be the same, but their difference shouldn’t be significant.

Draw a horizontal line (neckline) through a trough between two peaks. The price is supposed to close below the neckline. Your take-profit target will equal the distance between the tops and the neckline. However, the pattern may fail. Therefore, you need to place a stop-loss order above the neckline. The distance of the stop-loss target will depend on the price volatility. Don’t place it too close in highly volatile markets.
Final thoughts
Price action tells a lot about the strength of buyers and sellers. If you know how to read the market sentiment, you will succeed. Remember that indicators and patterns may fail, especially during uncertain or vital events. Combine price action and fundamental analysis.
***
Still think that price action is a difficult topic? Let our analyst Tony break this myth in his new video!

Tony is a financial analyst of the Binomo team. He is a trader with many years of experience in the market. Tony is the face of our YouTube and Instagram channels and is doing everything to help traders achieve new heights.
Trading with up to 90% profit
<span>Like</span>