
Retracements are key price action concepts for traders of any skill level. It allows you to enter a market at the best points and set accurate stop-loss and take-profit orders. Have you heard about this concept? Read on to discover four methods to enter a trade with a price retracement.
Earn profit in 1 minute
Retracements: definition, pros, and cons
The retracement concept is based on trend trading. Did you know that a long-term market trend is called a secular trend and lasts 5 to 25 years? A primary trend is a market trend that exists for at least one year. There is also a secondary trend that lasts for several weeks or months.
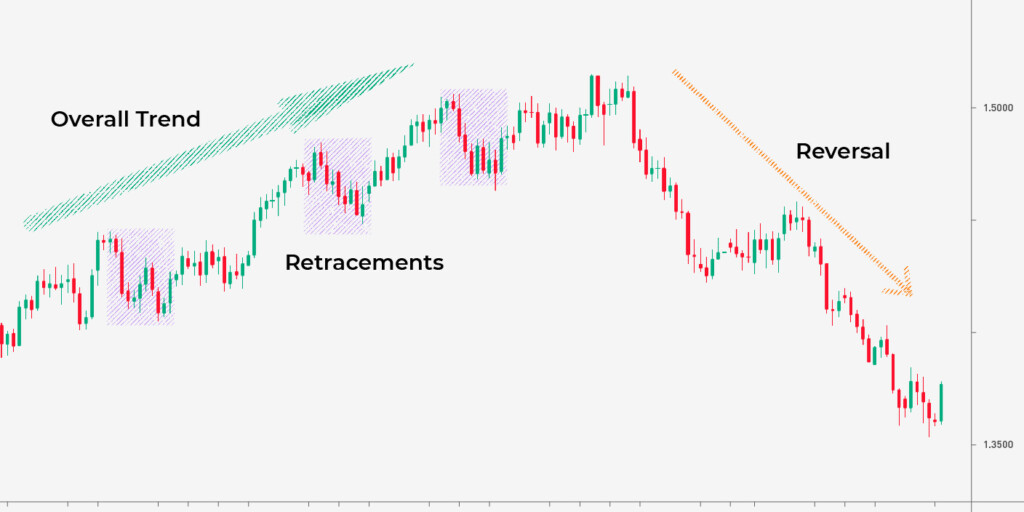
It’s vital to distinguish between a price retracement and a trend reversal. A retracement is a short-term price movement against the current trend but with a following return to it. Retracements occur in every trend that is bullish, bearish, or sideways.
Advantages of retracement trading
- Accurate entry points. Retracement trading implies a certain pattern of price movement—a trader expects it to return to the overall trend. Therefore, by defining a level where a retracement is supposed to end, you can enter the market at the best possible price and keep trading within the trend.
- Flexible stop-loss levels. By knowing where a price will likely move, you can set wider stop-loss and take-profit levels. Although a retracement may turn into a reversal, such risks occur only in highly volatile markets and due to significant events.
Disadvantages of retracement trading
- Risks of a reversal. As mentioned above, a retracement may turn into a reversal. However, if you always place stop-loss levels, you mitigate risks.
- Risks of stop-loss triggering. A stop-loss order in a retracement trade should be larger than the one you usually implement, as a price may be highly volatile at retracement levels.
Let’s move to retracement entry methods.
Effective strategies in your mailbox
Subscribe and discover a fund of trading knowledge
Great! Please check your email
We’ve sent you an email to confirm your subscription
Something went wrong
Try reloading the page. If that doesn’t help, please try again later
1. Key levels
A price always rebounds from support and resistance levels. They can be based on trendlines and previous reversal points. The more often a price rebounds from a level, the stronger the level is.
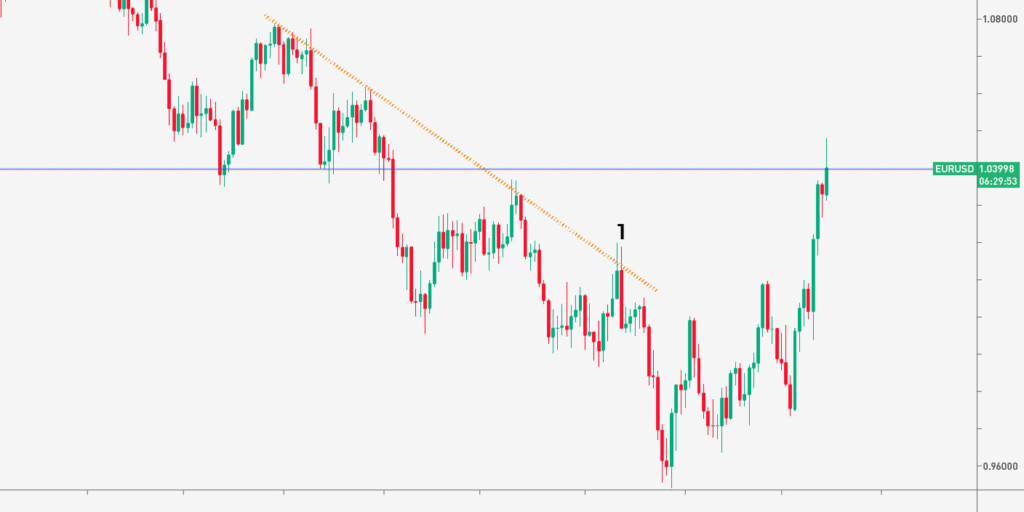
Look at the chart above. The price is moving within a downtrend. A trendline (orange line) serves as a resistance level. The price touched this level three times before the fourth retracement occurred (1). You could open a sell trade at that point. Also, you could implement a trailing take-profit order to move it depending on market conditions. A stop-loss level should be calculated considering the size of the take-profit point.
2. Moving average

A moving average (MA) indicator also serves as a support/resistance level. If a price moves in a trend, you can always add a simple moving average to identify an end of a retracement. A moving average’s period will depend on the timeframe you use.
Start from $10, earn to $1000
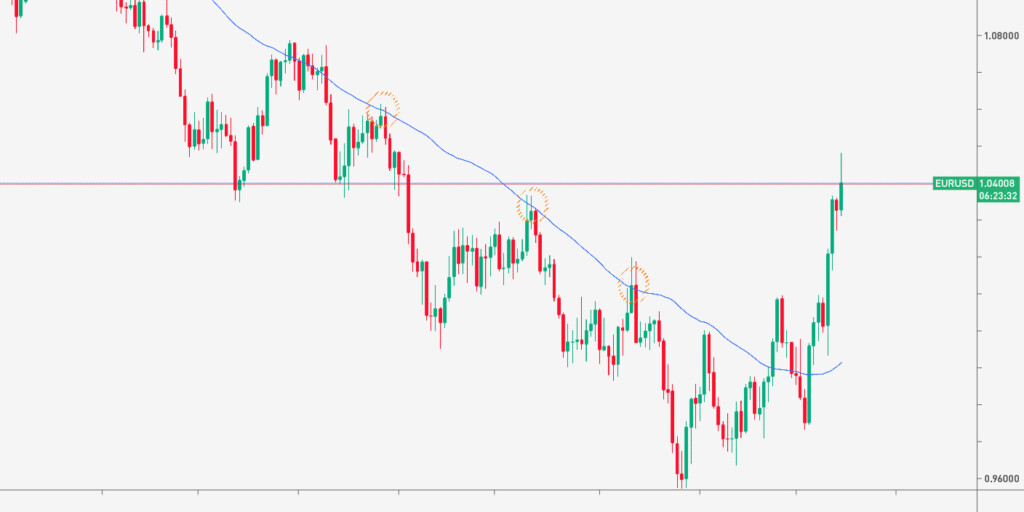
Look at the chart above. It’s a daily chart with a 50-day moving average. The price rebounded from the MA at least three times. You could open a sell position as soon as the price touched the MA and formed a bearish candlestick. Take-profit and stop-loss levels would depend on market conditions.
7 golden rules of trading
Everyone has their own trading style, but some principles are critical for success. Make sure you’re following these basic rules of trading.
Read more

3. 50% area retracement
It was discovered that a price retraces 50% of its major move.
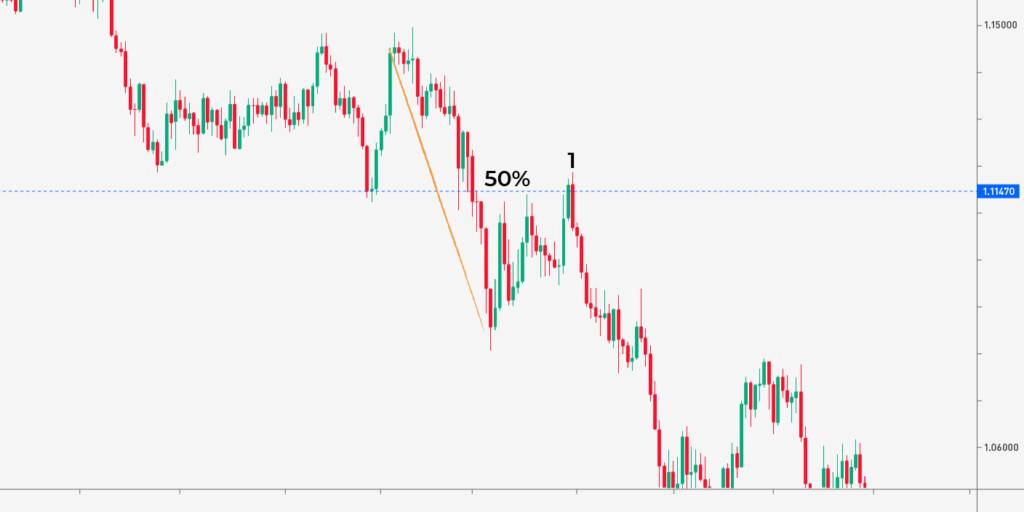
The chart above reflects such a situation. The price reached 50% of its previous move (1) and continued moving in a downtrend. You could open a sell trade as soon as the price formed a bearish candlestick after reaching the 50% point. Take-profit and stop-loss levels would depend on market conditions.
4. Fibonacci retracement
Talking about retracements, it’s essential to say about the Fibonacci retracement indicator. It automatically determines where the price is supposed to stop retracing.
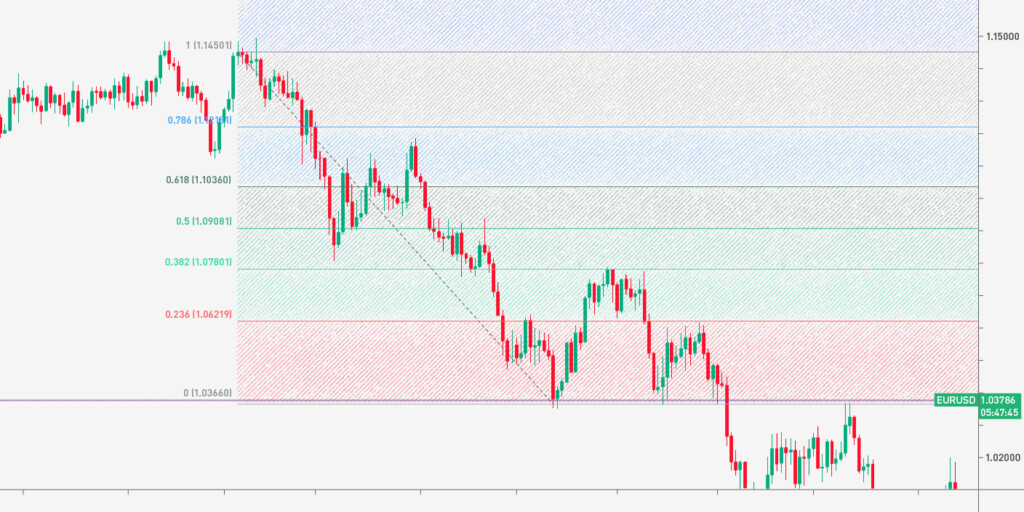
The chart above shows the price rebounded from one of the key Fibo levels—38.2% (1) and continued moving in a downtrend.
Note: the accuracy of Fibonacci signals depends on the ability to set it up correctly. Sometimes a price reverses before it reaches the level. You should closely monitor the market to open trades manually if needed.
Final thoughts
Although retracement trading is simple and accurate, there is no perfect rule, and sometimes the market goes against you. Every retracement trade should be based not only on support and resistance levels and a 50% rule but on additional signals of indicators and patterns. The essential tip is to confirm price movements with two signals of either two indicators or an indicator and a pattern.
Trading with up to 90% profit
+1 <span>Like</span>