
Technical indicators are an essential part of trading. They may reflect the level of volatility, predict a trend reversal, and signal potential entry and exit points. However, to make them work, you need to choose the right tools regarding the assets you trade, the timeframes you use, and the strategies you apply. Below you will find the most effective technical indicators that will help you trade safe-haven and risky commodities.
Start from $10, earn to $1000
Could you imagine that commodity markets originated in Sumer between 4500 B.C. and 4000 B.C.?
1. Bollinger Bands
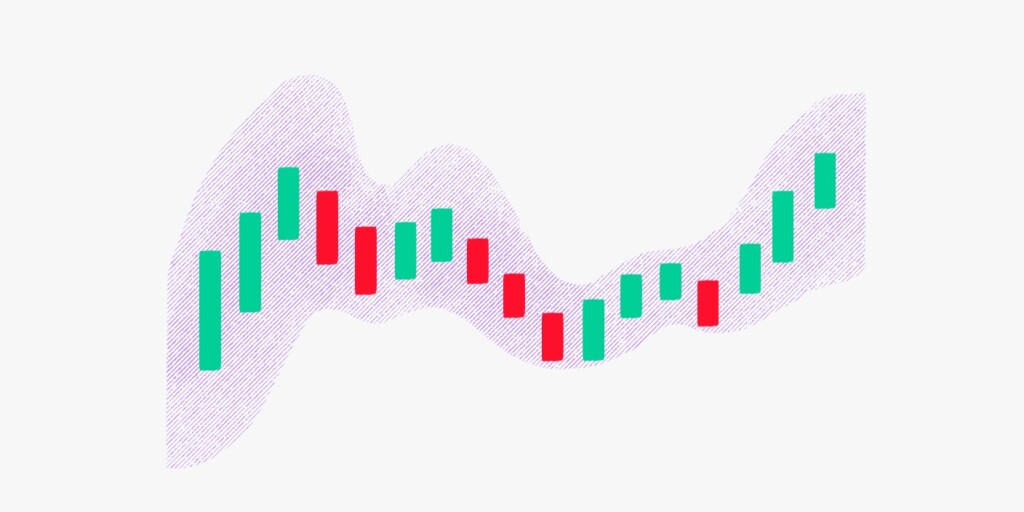
Bollinger Bands are a technical indicator that reflects the degree of volatility. It consists of three lines: lower bands, upper bands, and the middle line. When the bands diverge, the volatility rises. Aside from volatility signals, the indicator can help traders forecast a trend reversal. Usually, when the price reaches the upper band, it may turn down soon. However, a trend reversal isn’t confirmed until the price breaks below the middle line. Conversely, if the price is near the lower band of the indicator, it may rise soon. The uptrend isn’t confirmed until the price breaks above the middle line.
This indicator may be more beneficial for highly volatile commodities.
Effective strategies in your mailbox
Subscribe and discover a fund of trading knowledge
Great! Please check your email
We’ve sent you an email to confirm your subscription
Something went wrong
Try reloading the page. If that doesn’t help, please try again later
2. Moving Average (MA)
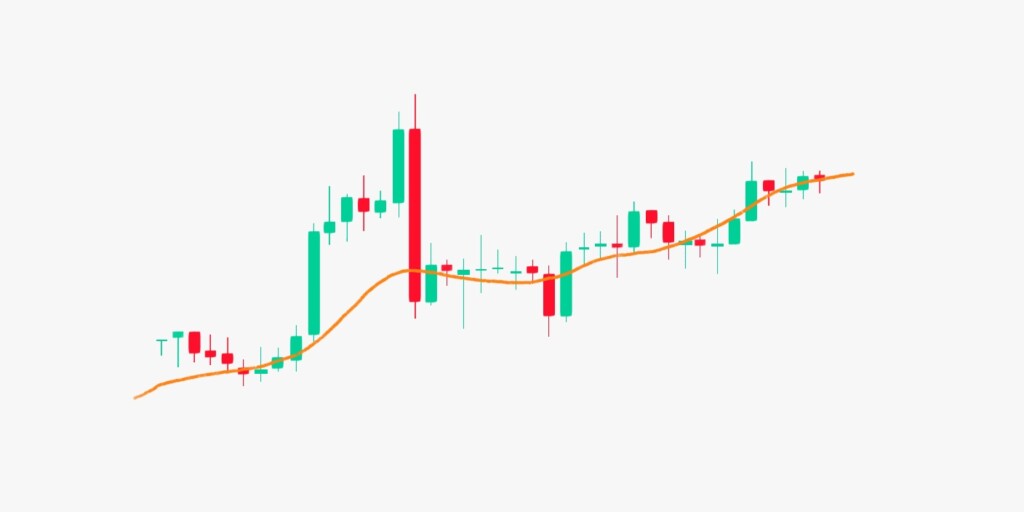
A simple moving average is a primary tool for analyzing any asset. This indicator reflects the overall market trend and predicts its change. Usually, traders apply two MAs with different periods and look for their interaction. The most common signals are the golden cross and the death cross.
- The golden cross appears when the moving average with a shorter period rises above the moving average with a longer period, signaling a potential uptrend.
- The death cross is a market condition when the MA with a shorter period falls below the MA with a longer period, signaling a possible downtrend.

Although the moving average is a lagging indicator that provides signals with a delay, it’s a reliable tool for identifying the overall trend. Still, it’s worth using MAs on high timeframes or when trading low-volatility commodities.
3. Relative Strength Index (RSI)
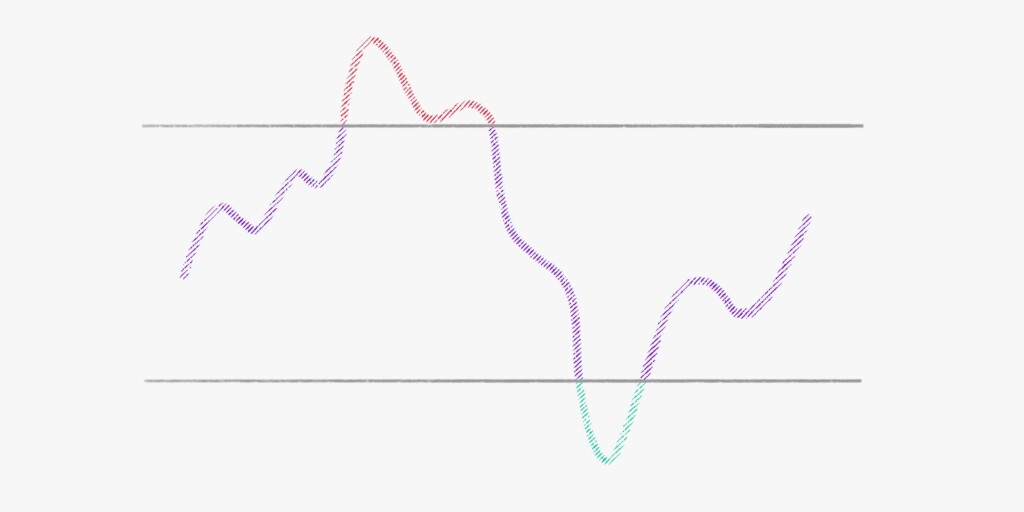
The relative strength index is an oscillator usually used when a trader looks for a trend reversal. Its most common signals are divergences and overbought/oversold conditions.
- A divergence between the oscillator and the price chart allows traders to predict when the price may turn around. A bullish signal occurs when the price forms lower lows, but the indicator moves up, placing higher lows. A bearish signal appears when the price continues forming higher highs, but the RSI falls.
- The oscillator has two key levels — 30 and 70. The price will likely rise when the RSI leaves the oversold zone and breaks above the 30 levels. If the RSI leaves the overbought area and falls below the 70 levels, it’s a sign the price may decline.
The relative strength index can be used for high and low-volatile commodities.
Cryptocurrencies: what to expect in 2023
2023 is expected to be the year of recovery for the crypto market. Read on to see what to expect in 2023 for cryptocurrencies.
Read more

4. Moving Average Convergence Divergence (MACD)
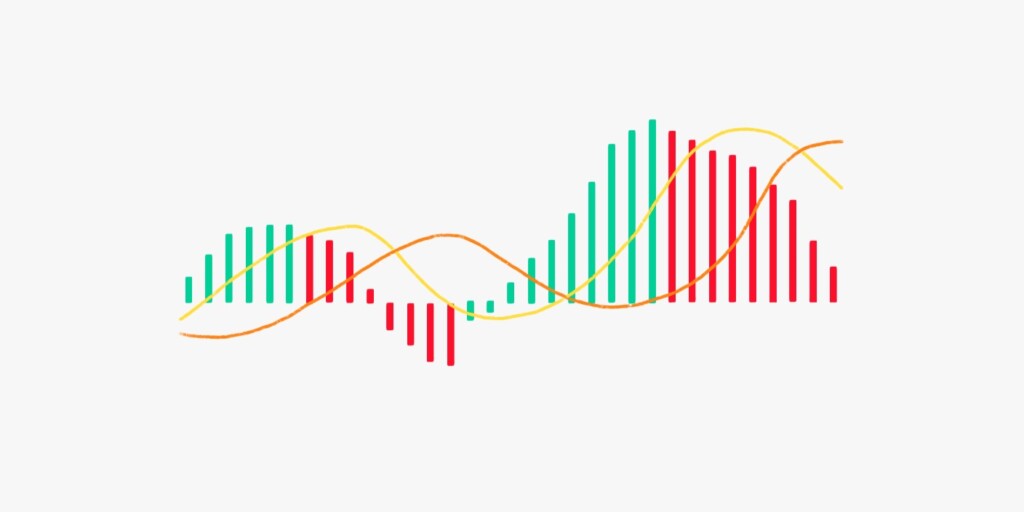
The MACD indicator is based on the moving average. Therefore, it’s also used to identify the market trend. Although it provides a few signals, the 0 line cross and divergence are the most common.
Earn profit in 1 minute
- The 0 level and the MACD histogram reflect a change in the price direction. When the histogram falls below the 0 lines, the price declines. When the histogram breaks above the 0 levels, the price rises.
- The divergence signals are the same as for the RSI indicator.
As the MACD tool is based on the moving average indicator, it provides delayed signals. Therefore, a trader may be confused when using it for high-volatility trading.
Final thoughts
Although commodity trading has unique features, a trader can apply technical indicators widely used for other assets. Still, it’s vital to consider the volatility of the instruments you trade. Not all commodities are stable — some may surprise you with a significant volatility level.
Sources:
Commodity Investing: Top Technical Indicators, Investopedia
Commodities Trading and Technical Analysis, The Balance
Trading with up to 90% profit
<span>Like</span>