
The standard deviation indicator, often illustrated as the StdDev indicator, is one of the technical bases that every trader needs to be acquainted with. Not only does it help to indicate the best time to enter the market, but this indicator gives traders a foresight on possible trend reversal. What does that even mean? When stock or oil prices pick up a bear or bull rally, the StdDev indicator can help you spot definite points on the price chart when the price rally can take a possible U-turn.
With this in mind, this indicator can significantly impact your portfolio and investment strategy. Now let’s take a deep look into what the StdDev indicator is and how you can harness its potential in understanding the up-and-down movement of the global market to make informed trading decisions.
StdDev 101: The idea behind the indicator
When trading the global market, volatile and liquidity assets are involved. Thus, a trader must understand the idea behind the standard deviation indicator and how to adjust complementary indicators to make the chart sensitive to market volatility. This will involve moments when there is a sudden spike in the price trend, and the trader needs to open or close a position quickly.
The general purpose of this technical indicator is to work in tandem with other indicators. For instance, the spread between the Bollinger Bands can be determined using the basis of standard deviation.

Now that we have gotten our hands on the basics of this trading indicator, it is time to look at the mathematical expression that supports its function.
Effective strategies in your mailbox
Subscribe and discover a fund of trading knowledge
Great! Please check your email
We’ve sent you an email to confirm your subscription
Something went wrong
Try reloading the page. If that doesn’t help, please try again later
The trading formula for the StdDev indicator—(New traders watch)
If, as a trader, you are curious about the mathematical expression of standard deviation, it is simply the square root of the variance. In explicit terms, variance is the summation of the (squared) value obtained from subtracting the mean [x] from individual values in a data set divided by the total number of values in that set.
The formula below expresses it:
[σ (x) = √V (x)]
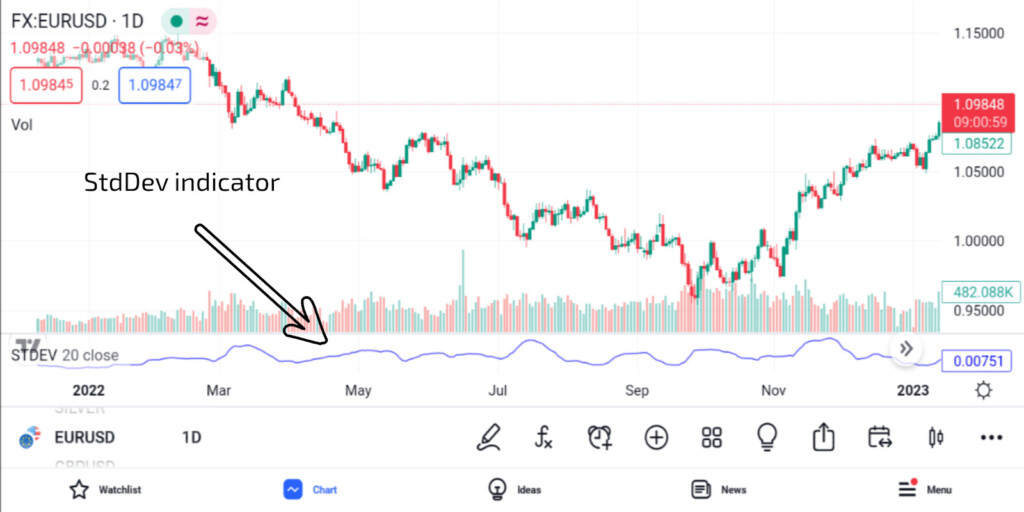
How and when to use the StdDev technical indicator?
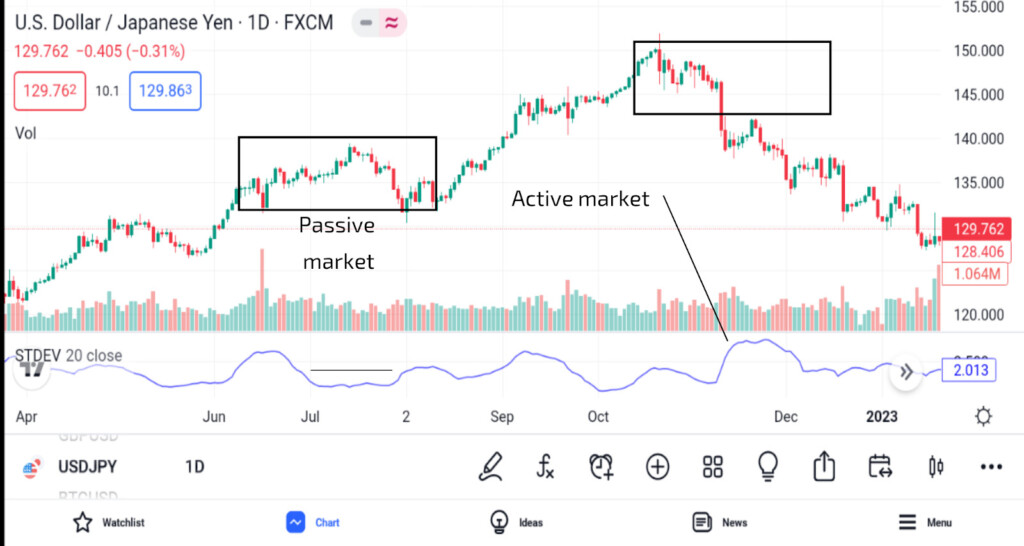
The StdDev indicator helps determine price reversals or trade breakouts. Interpreting the signal provided by the standard deviation indicator depends on whether the price shows low or high volatility. When there is a low standard deviation, it indicates an inactive or low-volatility market. This ultimately means there is the potential for a price spike or breakout to occur. Conversely, if the standard deviation is high, it signals high market volatility. Decreased level of activity is expected in this case.
Apart from providing low or high volatility signals, the StdDev indicator can identify signals based on the interrelation between the bottoms and tops and the concerned volatility level. In this regard, a trader can read the following signals by identifying tops and bottoms using the StdDev indicator.
Cryptocurrencies: what to expect in 2023
2023 is expected to be the year of recovery for the crypto market. Read on to see what to expect in 2023 for cryptocurrencies.
Read more

Application and benefits of StdDev indicator
—Developing bull market:
You can get the signal that tells you when a bull market is maturing. Using an extended time frame, you can be sure if a bull run is in progress when low volatility is identified with the price tops.
—Wavering traders:
How do you know when traders are hesitating to move in the market? High volatility on the StdDev indicator and identified price tops in a short time frame reveal this.
—No interest from traders:
Using the StdDev indicator on a longer time frame with low volatility and identified price bottoms signals a possible lack of interest in an underlying asset.
—Identifying panic sell
The panic sell-off signal can be identified when price bottoms are associated with high volatility in a short time frame with the StdDev indicator.
Conclusion: embracing value application

The standard deviation indicator is a battle-proven volatility quotient that seeks to make trading the global market speculative. If you include this indicator in your trading strategies, try to identify the bottoms or tops of the price chart. This is because the indicator will signal that the price will move toward the mean value.
Also, remember that every trading strategy has a potential risk. You can use the StdDev indicator to set a stop-loss to reduce your portfolio’s exposure to risk.
Sources:
Currency.com; Standard deviation explained: How to read and use the indicator
CMC Markets; Standard deviation indicator
<span>Like</span>