
Scalping is one of the most popular trading techniques, but it’s quite challenging. You need lots of knowledge, experience, and effective technical analysis tools to succeed at scalping. You can experiment with various indicators, but there are some you can use right away to build your best scalping strategy.
This trading approach has an interesting name because traders act very quickly, so they skim small returns off many trades. Traders utilizing this method are called scalpers.
Earn profit in 1 minute
Exponential moving average
The exponential moving average is considered the best moving average for scalping, as it adds more weight to the most recent prices. This makes it more sensitive to price fluctuations. There is no perfect setting for EMAs, and scalpers can use EMAs of different periods.
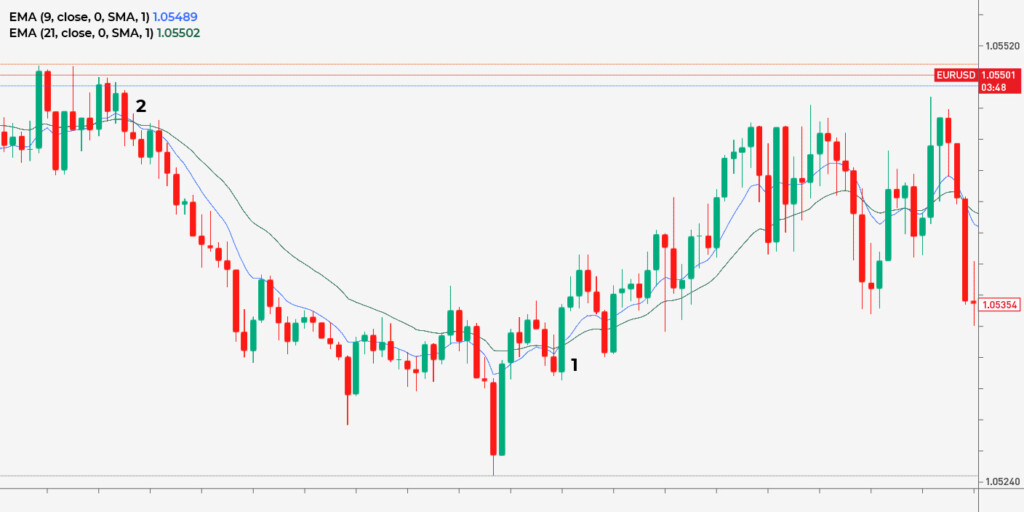
- Crossovers. Many traders base their signals on EMAs crossovers. The common rule is: when the EMA with a shorter period breaks above the EMA with a longer period, it’s a buy signal (1); when the EMA with a shorter period moves below the EMA with a longer period, it’s a sell signal (2).
- Trend direction. Another method is to consider whether the price is above or below the moving average. If it’s above, the price is rising; if it’s below, the price is falling. However, this information can’t be used by itself, as it doesn’t provide buy and sell signals.
Effective strategies in your mailbox
Subscribe and discover a fund of trading knowledge
Great! Please check your email
We’ve sent you an email to confirm your subscription
Something went wrong
Try reloading the page. If that doesn’t help, please try again later
MACD
MACD, or moving average convergence divergence, is an oscillator that measures price momentum. Traders use it with basic parameters of fast EMA with a period of 12, slow EMA with a period of 26, and a signal line with a period of 9. The MACD provides various signals, including convergence/divergence and a crossover of the 0 line.
- 0 line crossover. The MACD consists of a histogram and two lines – MACD and a signal line. When the histogram rises above 0, it’s a sign that the price will rise (1). Conversely, when the histogram falls below 0, the price is expected to decline (2). As scalping is done on low timeframes, traders enter the market as soon as a breakout occurs, not when the histogram is above or below 0.
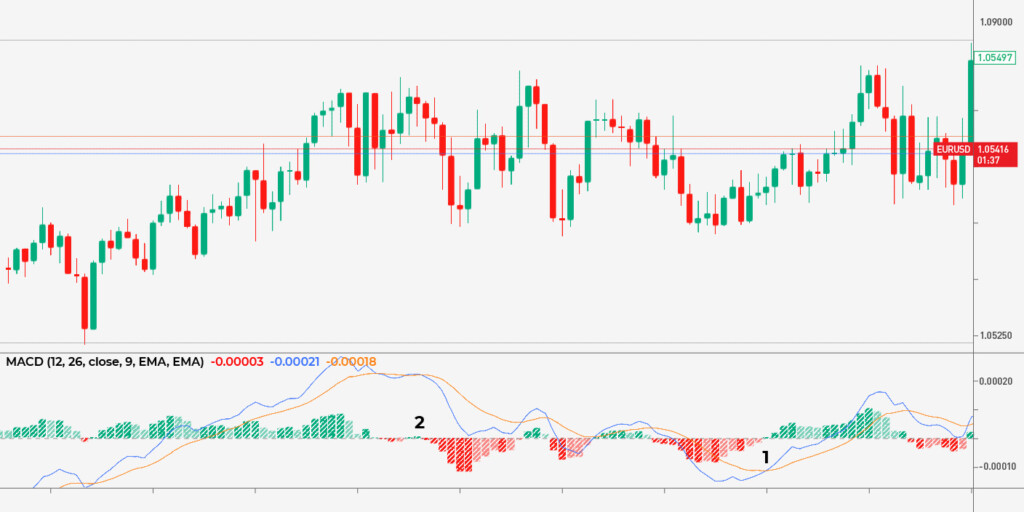
- Convergence/divergence. Convergence/divergence is another popular signal that scalpers use. It appears when the price and the MACD move in different directions – when the price rises, the MACD declines, and vice versa. The four signals are shown in the picture below.
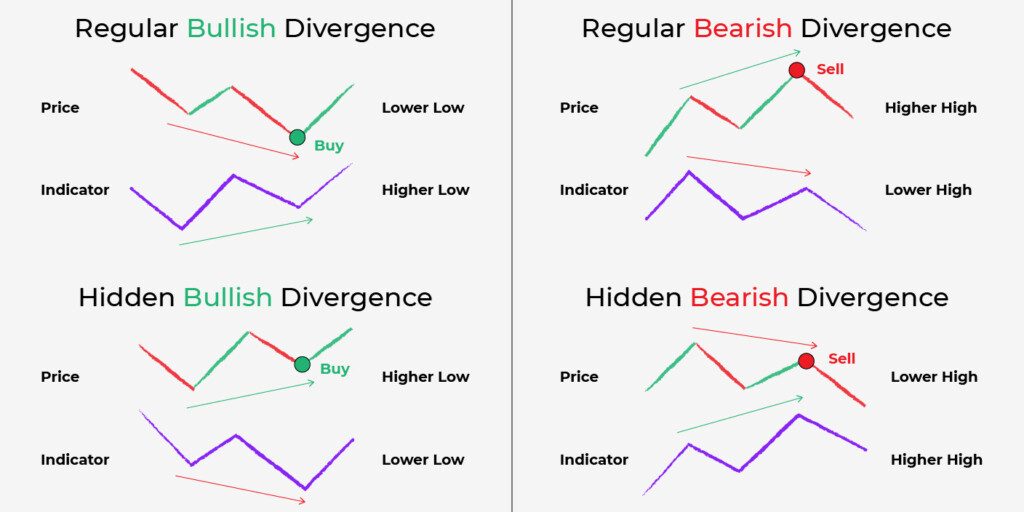
On short timeframes, the indicator provides too many convergence/divergence alerts, but a few of them work. Therefore, each signal must be confirmed with another technical analysis tool, including indicators, candlesticks, and chart patterns.
RSI
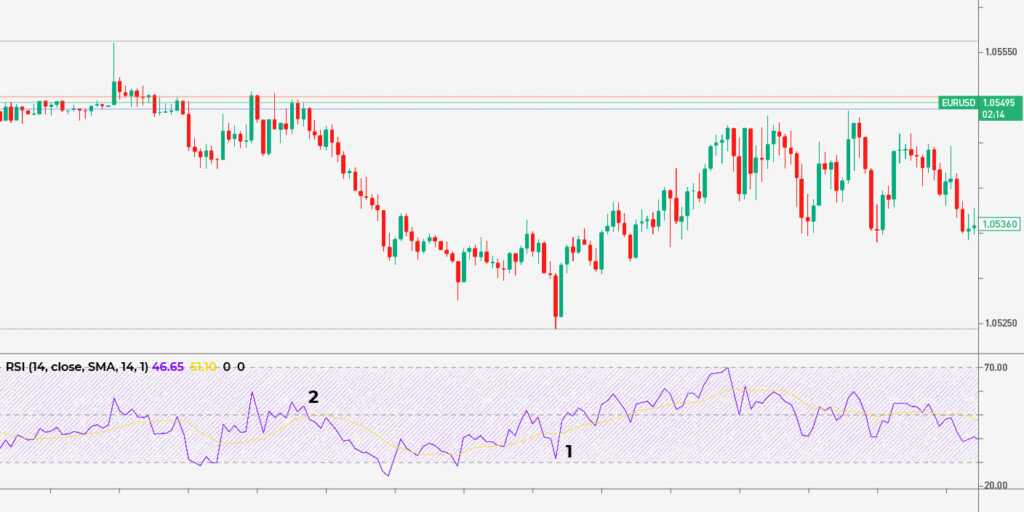
RSI, or relative strength index, is another scalping indicator. It’s often combined with the MACD indicator for signal confirmations. It reflects overbought/oversold market conditions, provides divergence signals, and reflects buy/sell opportunities when used together with the simple moving average (SMA). Traders can use it with its standard period setting of 14.
Overbought/oversold conditions don’t help scalpers much, so they use only divergence alerts and RSI/SMA crossovers.
- Divergence. The divergence signals are the same as for the MACD indicator and can be seen in the picture above.
- RSI/SMA crossovers. There is the RSI indicator with the implemented SMA. However, if your trading platform doesn’t provide one, you can manually add the SMA to the oscillator. The period of the SMA is usually the same as the period of the RSI – 14, and the standard deviation should be 1, as a larger one may make signals less effective on short timeframes. When the RSI breaks above the SMA, it’s a buy signal (1). When the RSI falls below the SMA, it’s a sell signal (2).
Top 5 sitting postures for traders
Many traders think less about their sitting postures, negatively impacting their health. Check it out!
Read more

Stochastic oscillator
The stochastic is sometimes confused with the RSI, as both are oscillators that provide similar signals. Therefore, traders don’t combine them. However, the frequency of their signals varies. You can choose either one for your own trading approach.
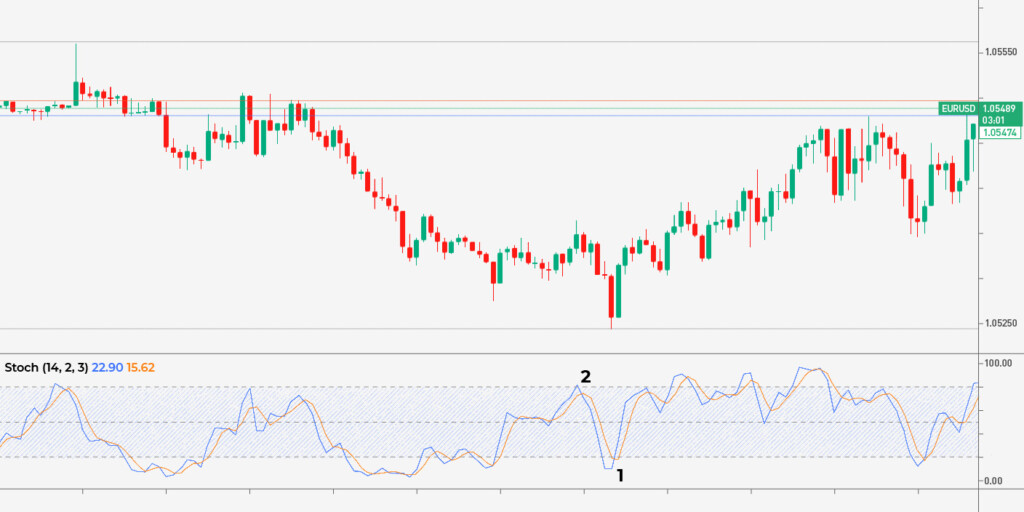
Scalpers can use the indicator with its standard period setting of 14, the %K line’s smoothing period of 1, and the %D line’s smoothing period of 3. However, by increasing the %K’s period to 2, you can lower the frequency of crossover signals which is better on low timeframes.
As for the RSI indicator, overbought/oversold conditions don’t provide reliable signals for scalpers. Therefore, they use divergence alerts and %K and %D crossovers: when %K rises above %D, the price is expected to increase (1); when %K falls below %D, the price is expected to decline (2).
Bollinger bands
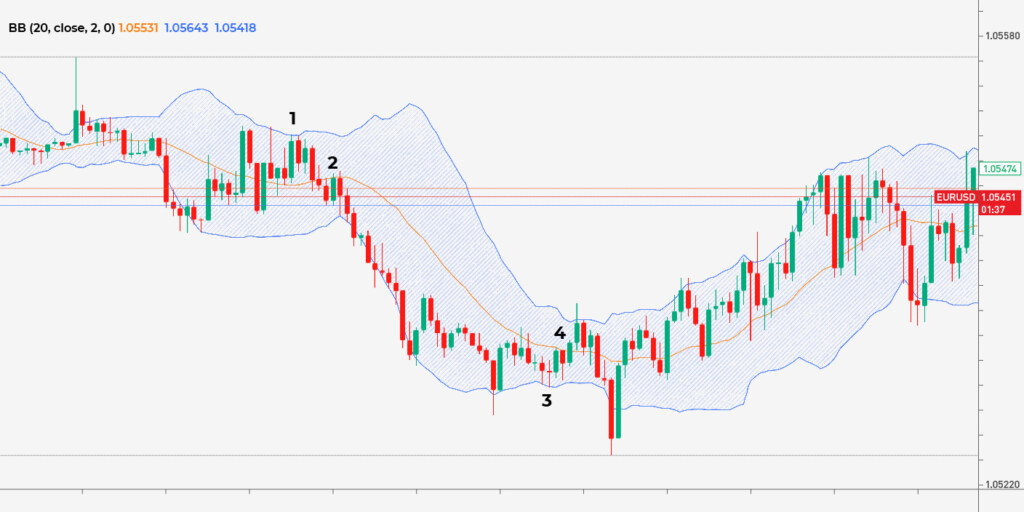
Scalpers prefer increased volatility, as significant price fluctuations allow them to gain more quickly. The common rule is that volatility increases when bands move away from the middle line and vice versa. Scalpers can use the indicator with its standard settings – a period of 20 and a standard deviation of 2.
To catch buy/sell signals, you need to look at the price location relative to bands and the middle line. When the price touches the upper band, it’s a sign it will fall soon (1). If the breaks below the middle line, it’s a signal the fall will continue (2). Conversely, when the price touches the lower band, it will likely rise soon (3). A break above the middle line signals the rise continuation (4). You can either open several trades or use a trailing take-profit order.
Final thoughts
The above-mentioned indicators are highly effective tools you can use to create your best strategy for scalping. You can utilize popular methods or develop your own after testing indicators on a demo account. However, it’s vital to remember that the signals mentioned above won’t work solely. You must combine several indicators so that they reflect accurate entry and exit points.
Sources
Scalping, babypips.com
+6 <span>Like</span>