
A trend is a condition when an asset’s price moves in a certain direction. There are up, down, and sideways trends.
According to statistics, trends account for only 15-20% of price movements; the rest of the time, the price fluctuates within ranges.
A trend offers numerous opportunities for traders. That’s why it’s vital to identify its strength. Read on to learn the most effective ways to determine an ending trend.
Earn profit in 1 minute
Breakouts
Trends are usually framed with trendlines. They serve as support and resistance levels. When the price breaks them, it signals a trend end and is called a breakout.
Still, there is a risk of a fakeout. This is when the price breaks the level but returns to the trend. To avoid getting into a fakeout trap, you should be sure the price breaks the following strong support/resistance levels.
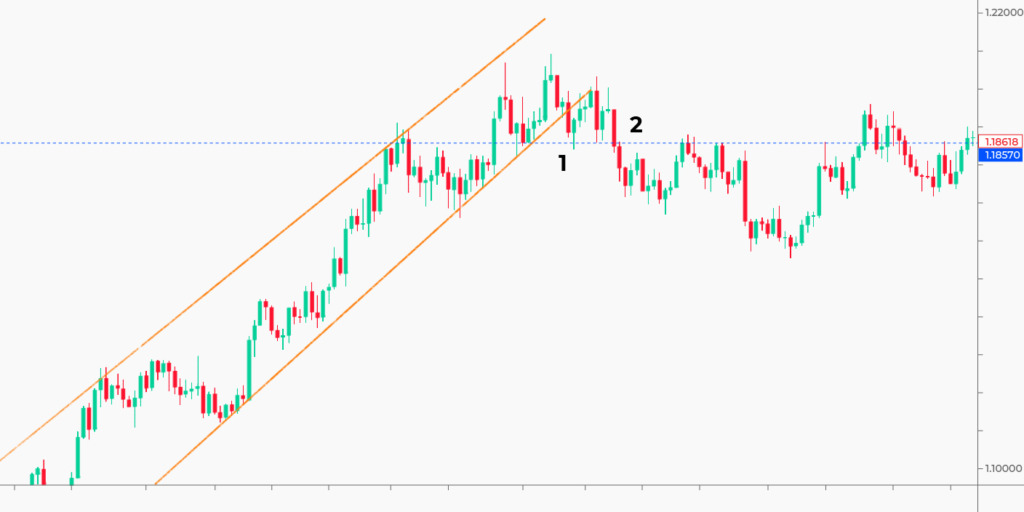
The chart below depicts a long-term uptrend. EUR/USD fell below the lower band of the upward channel (support). It could be a fakeout as the pair rebounded from the support level (1). However, several days later, it broke below this level (2), and the uptrend ended.
Effective strategies in your mailbox
Subscribe and discover a fund of trading knowledge
Great! Please check your email
We’ve sent you an email to confirm your subscription
Something went wrong
Try reloading the page. If that doesn’t help, please try again later
Volumes
Volumes reflect how strong buyers and sellers are. When they don’t have forces to drive the price, volumes decline. There are numerous volume indicators you can use.

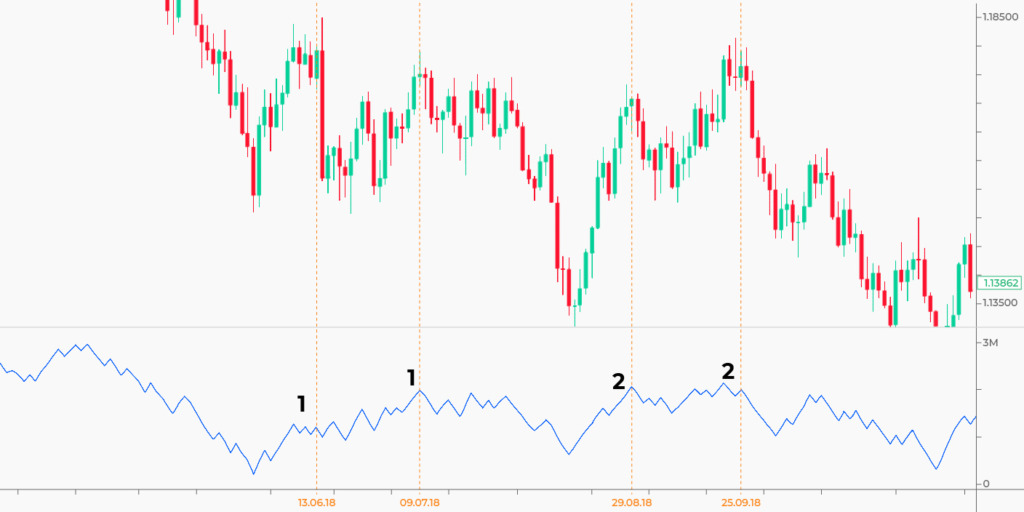
The chart below depicts the on-balance volume indicator. When there is an uptrend, it rises. When there is a downtrend, it falls. When a divergence occurs, it signals a trend change.
In the first case, the price formed a lower high, but the indicator continued rising. It was a signal bears weren’t strong enough to pull the price down. In the second case, the price formed a higher high, but the indicator didn’t follow. Afterwards, the price formed a bearish trend.
Moving average
Traders like a simple moving average because of its ease. When the price is above the MA, it’s an uptrend. When the price is below the MA, it’s a downtrend. A trend’s end is confirmed when the price changes its position relative to the MA.
Trading with up to 90% profit
A period of MA depends on the timeframe. If you check a long-term trend change, you can use MAs with 50, 100, or 200 periods. The higher the timeframe is, the larger period the MA should have.
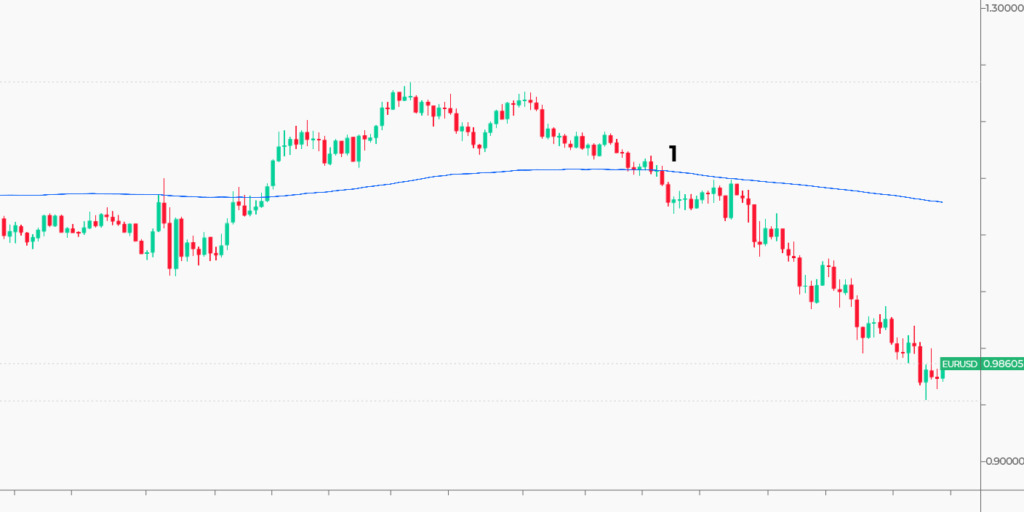
The picture below shows a weekly timeframe with the 200-week moving average. When the price fell below the MA (1), a new downtrend was confirmed.
The MA can be used on low timeframes, but its signals won’t be solid as short-term trends change fast.
How to start trading with $200 and minimum risk
Don’t let a small budget deter you from trading! Learn how to start trading with $100 or $200 and make the most out of this money!
Read more

Chart patterns
Reversal chart patterns occur often and provide reliable signals. The most popular patterns are head and shoulders, inverse head and shoulders, double bottom/top, triple bottom/top, and rising/falling wedges.
There are bilateral patterns that can be both reversal and continuation. However, their signals can be confusing for newbies.
To identify a trend end with chart patterns, you need to learn their rules. For example, the head-and-shoulders pattern won’t work at the end of a downtrend because it should be placed at the end of a bullish trend.
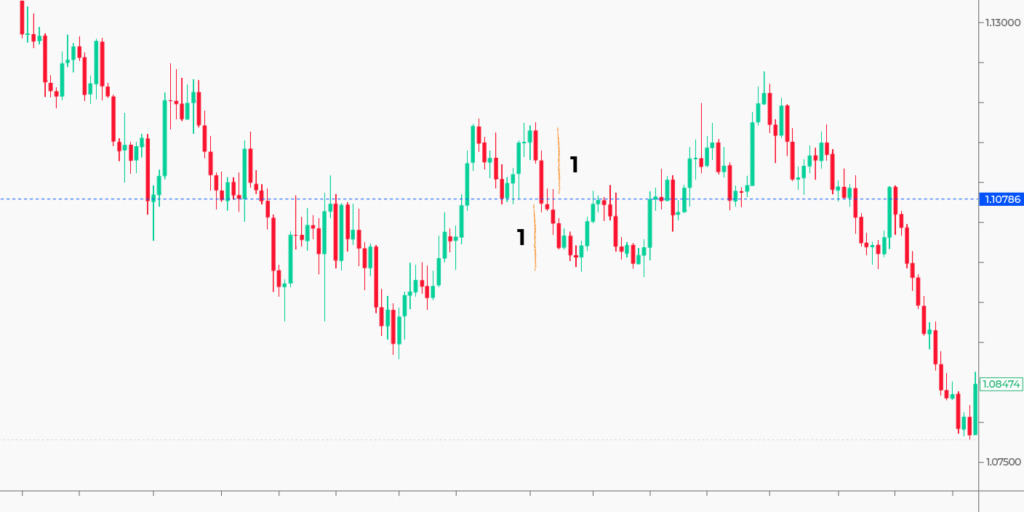
The chart below reflects the double-top pattern. It formed at the end of the medium-term bullish trend. The new downtrend was short, but the pattern worked as the price went the distance (1) between the tops and the neckline (blue line), which was the pattern’s target.
Relative strength index
A trend changes when buyers and sellers become weak. Overbought and oversold conditions can accompany such periods. When an asset is overbought, buyers don’t have the strength to keep buying, so the price falls. When an asset is oversold, sellers don’t have the strength to sell, so the price rises.
You can identify such market conditions with the relative strength index. When the RSI line is above the 70 level, the market is overbought. When the RSI is below the 30 level, the market is oversold.
On the chart below, the RSI indicator entered the oversold area long before the market started correcting. However, the indicator warned that the trend would turn around soon.
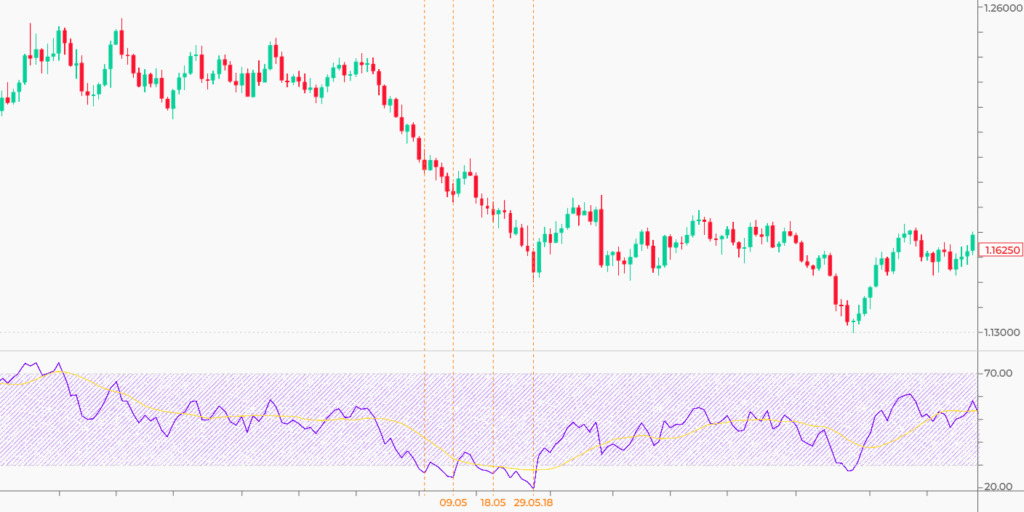
Note: The lower the timeframe, the weaker the RSI signals will be. The RSI line may return to the overbought/oversold area several times before the trend changes. Use the signals mentioned above to get a confirmation.
Summing up
If you know the strength of a current trend, you will succeed. Don’t try to trick the market, and don’t go against the trend.
Start from $10, earn to $1000
<span>Like</span>