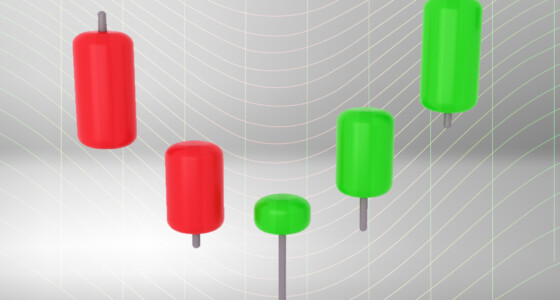

Japanese candlestick is the most popular chart type used by traders. Japanese candlestick patterns are one of the methods used to predict a price direction. All patterns are divided into bullish, bearish, and neutral, as well as reversal and continuation.
According to some research, there are over 60 patterns. However, you don’t need to learn all of them. Below, you will find the most common candlestick pairs.
Earn profit in 1 minute
1. Hammer and hanging man
These patterns consist of one candle.
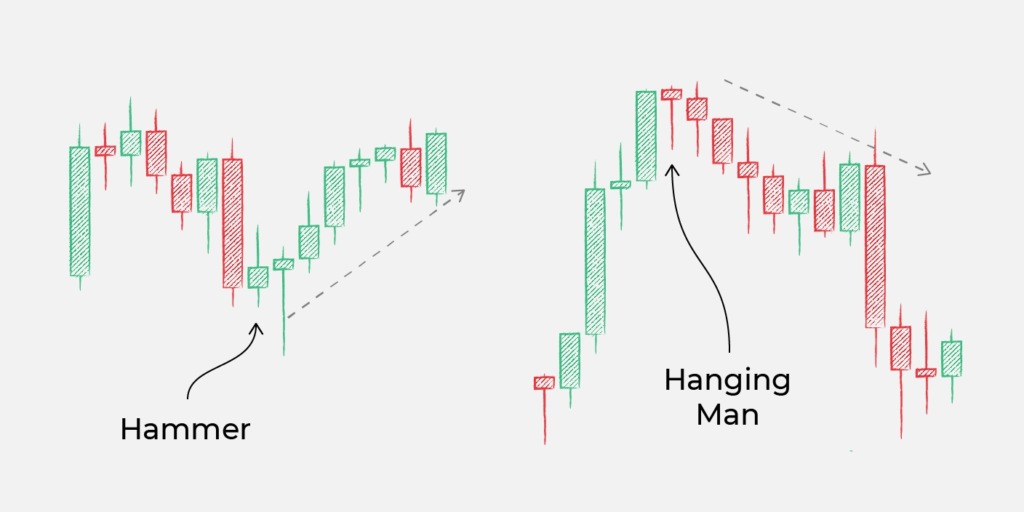
A hammer candlestick appears at the end of the bearish trend. Its lower shadow should be at least two times bigger than its body. The color doesn’t matter. However, if the candle is bullish, the signal is stronger.
A hanging man candle looks similar, but it appears at the end of the bullish trend. The color also doesn’t matter, and the lower shadow should be at least two times bigger than the candle’s body.
Effective strategies in your mailbox
Subscribe and discover a fund of trading knowledge
Great! Please check your email
We’ve sent you an email to confirm your subscription
Something went wrong
Try reloading the page. If that doesn’t help, please try again later
2. Inverted hammer and shooting star
These patterns also consist of one candlestick.
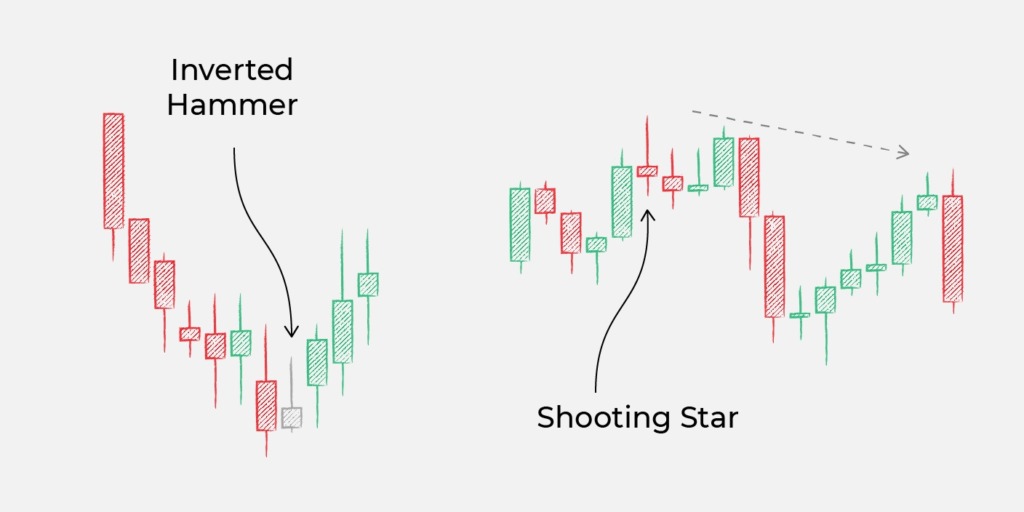
An inverted hammer appears at the end of a bearish trend. The pattern’s upper shadow is at least two times bigger than its body. The color doesn’t matter. But if the candle is bullish, the signal is stronger.
A shooting star pattern is one of the bearish candlestick patterns. It consists of a small body and an upper shadow that is at least two times bigger than the candle’s body. If the candle is bearish, the signal is stronger.
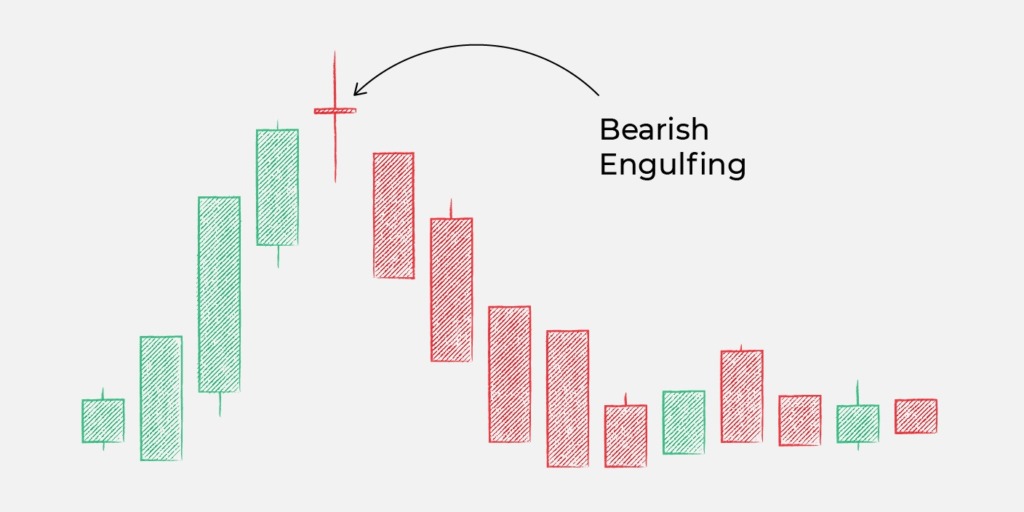
3. Bullish and bearish engulfing
It’s another pair of trading candlestick patterns. They include two candlesticks.
Start from $10, earn to $1000
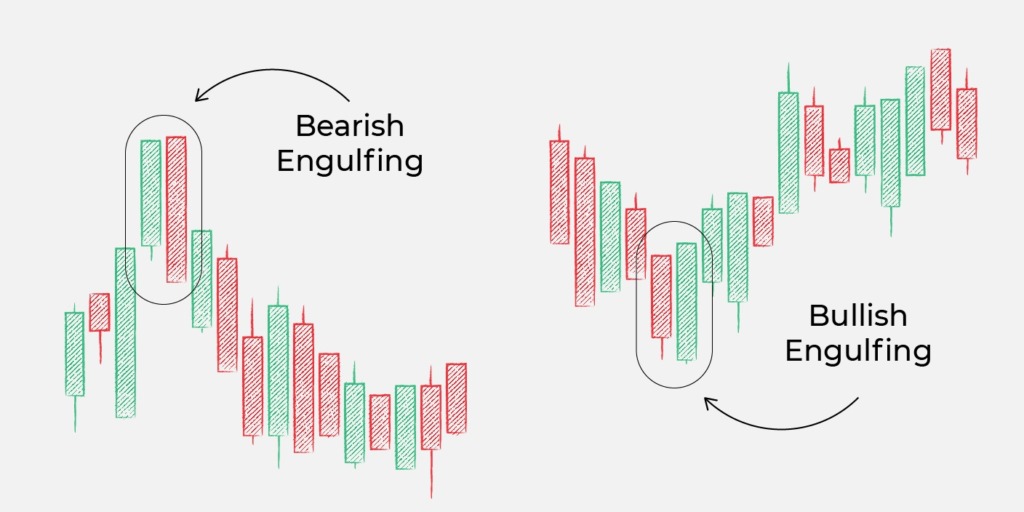
A bullish engulfing pattern occurs at the end of the bearish trend. The first candlestick should be bearish, and the second one should be bullish. The second candle should open below the closing price of the first candle and close above the opening price of the first candle. This means that the second candle engulfs the first one. The bigger the second candle, the stronger the signal.
A bearish engulfing pattern appears at the end of the bullish trend. The first candle is bullish, and the second one is much bigger and bearish. The opening price of the second candle should be above the closing price of the first one, while its closing price should be below the opening price of the first one.
Cryptocurrencies: what to expect in 2023
2023 is expected to be the year of recovery for the crypto market. Read on to see what to expect in 2023 for cryptocurrencies.
Read more

4. Morning star and evening star
These are three-candlestick patterns.
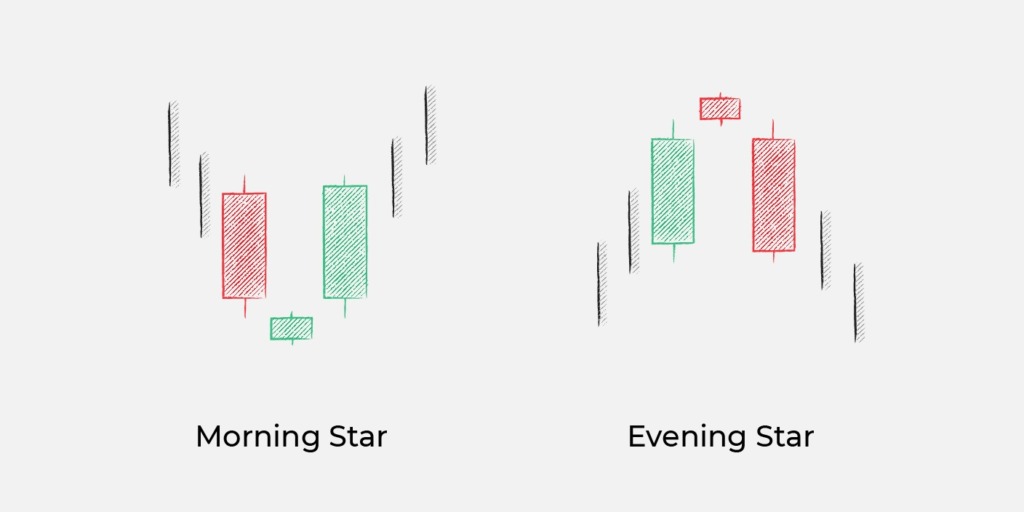
A morning star is a bullish pattern that consists of three candles. The first one is bearish. The second one is either bullish or bearish. The color doesn’t matter, but if it’s bullish, the signal is stronger. The third candlestick is bullish and usually bigger than the first one. The morning star candlestick should be smaller than the other two candles.
An evening star pattern is the opposite of the morning star. It occurs at the end of a bullish trend. The first candle should be bullish. The second one has a small body, and its color doesn’t matter. The third one is bearish and usually bigger than the first one.
There can be a gap before and after the second candle. If it occurs, the signal is even stronger.
5. Three white soldiers and three black crows
These patterns also consist of three candles.
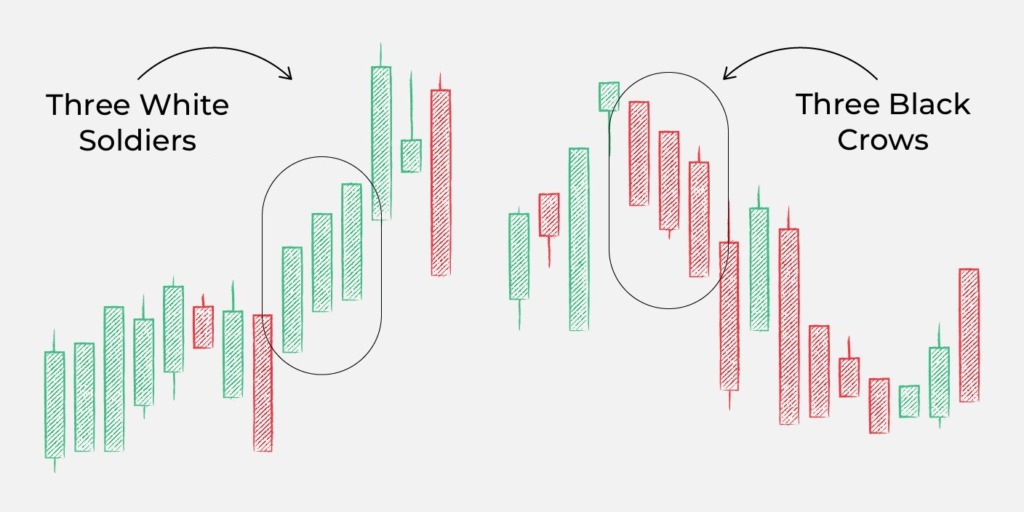
The three white soldiers pattern is one of the bullish candlestick patterns. Each of the three candles should close higher than the previous candlesticks. Their opening prices should be within the body of the previous candle. The candlesticks should be bullish.
Three black crows is an opposite pattern. It consists of three bearish candlesticks and predicts a bearish trend. Each candle should close at a new low, while its opening price should be within the body of the previous one.

Both patterns are reliable, but if the fourth candlestick has the same color or is formed with a gap, the signal is stronger.
6. Falling and rising three methods
These candlestick patterns confirm a continuation of the current trend.
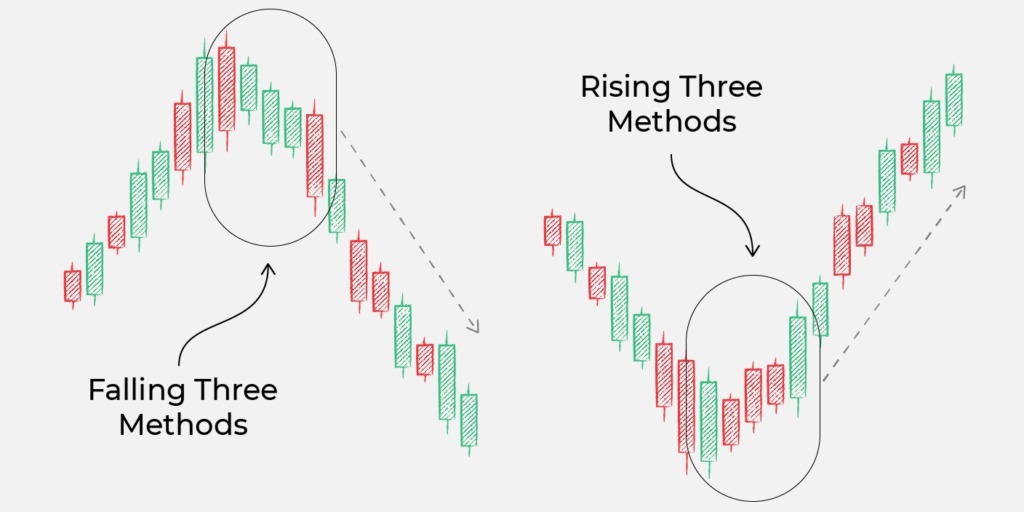
A falling three methods pattern consists of three small green candles with red candlesticks before and after them. Green candlesticks should be small and located within the range of bearish candles’ bodies. The pattern shows that bulls didn’t have enough strength to push the price.
A rising three methods is a bullish pattern that consists of three small bearish candles. The candles should move within the range of two bullish candles’ bodies, which appear before and after them. The pattern confirms bears weren’t strong to pull the price.
7. Long-legged doji
A doji candlestick is neither bullish nor bearish. It reflects the uncertainties buyers and bears have. The candlestick has a small body that reflects that neither bulls nor bears could take control over the market and long shadows that show significant price volatility caused by market uncertainties. When the doji candlestick appears, you can’t make conclusions about the future price direction.
Takeaway
Candlestick patterns are standard tools that occur on a chart of any asset. Thus, you can find Forex candlestick patterns, crypto patterns, commodity candle patterns, etc. This fact makes them essential tools you need to predict a price direction. If you learn them by heart, you will succeed.
Trading with up to 90% profit
+21 <span>Like</span>