
Fibonacci retracements and extensions are popular among traders with any level of experience, while trend lines are the first thing traders apply when analyzing market conditions. It’s not surprising that Fibonacci tools are combined with trend lines when developing various trading strategies, as both serve as support and resistance points that a price interacts with. Below, you will find seven rules you can utilize to develop a trading strategy with trendlines and Fib retracements and extensions.
Earn profit in 1 minute
Rule #1: Learn the terms
Before you start combining any technical analysis tools, you must learn their mechanics. First, you should ask, “What does the trend line mean?” and “What do Fibonacci levels stand for?”
A trend line is used by traders to identify the market trend – either bullish or bearish. Any trendline is valid only when drawn through at least two highs or lows. A trendline drawn through lows serves as a support level. Conversely, it’s considered a resistance level if it goes through highs.
Fibonacci tools are horizontal levels that also serve as support and resistance points. Fibonacci retracements are used during a pullback from a larger move, while Fibonacci extensions are implemented after a price pulls back.
Did you know that Fibonacci levels are based on the golden ratio – the ratio that appears in some patterns in nature, e.g., the spiral arrangement of leaves?
Effective strategies in your mailbox
Subscribe and discover a fund of trading knowledge
Great! Please check your email
We’ve sent you an email to confirm your subscription
Something went wrong
Try reloading the page. If that doesn’t help, please try again later
Rule #2: Learn how to draw a trend line and Fibonacci levels

To make technical analysis tools work, you should learn how to place them on a price chart. You have learned that a trendline goes through at least two points. In an uptrend, the price will set higher highs and lows, while in a downtrend, it will form lower highs and lows. A trend can be identified by eye, but trend lines are required to specify entry and exit points.
To draw Fibonacci levels, you need to determine a trend’s low and high. In an uptrend, you should place the first point on a low and draw a line to a high. In a downtrend, you should find a peak and draw the line from it to the trend low.
Rule #3: Determine a trend
Before trading on Fibonacci and trend lines, you should understand where the price may move. Determine a trend, evaluate its strength, and analyze current market conditions to assume the following price direction. Fibonacci levels are used for a price pullback which means you should expect the trend to continue.
Cryptocurrencies: what to expect in 2023
2023 is expected to be the year of recovery for the crypto market. Read on to see what to expect in 2023 for cryptocurrencies.
Read more

Rule #4: Find interconnections between Fibonacci retracements and trend lines
A trader always looks for a signal confirmation. As trend lines and Fib levels serve as support and resistance points, you should find their interconnections.
Start from $10, earn to $1000
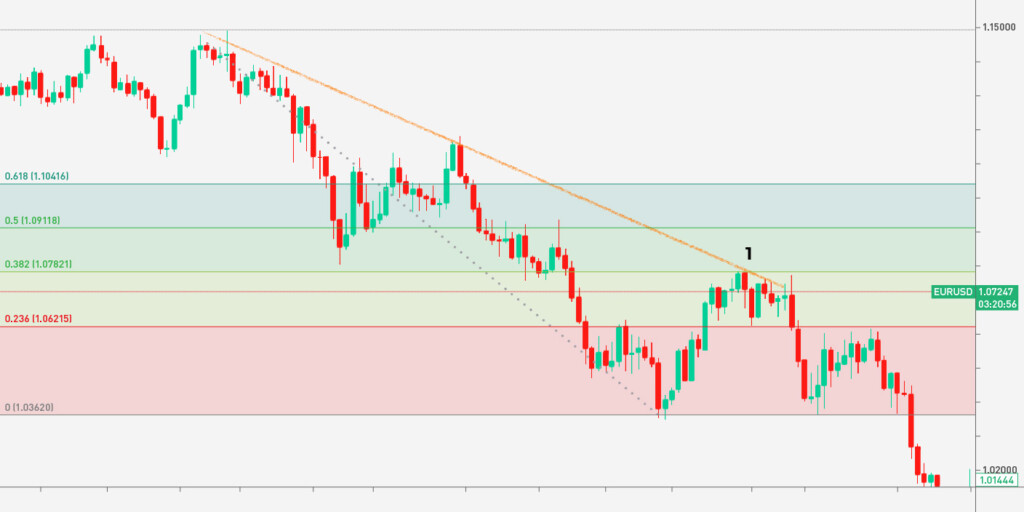
In the chart below, the trendline and Fibonacci interacted at 0.382 Fib retracement. You could use this to open a sell position.
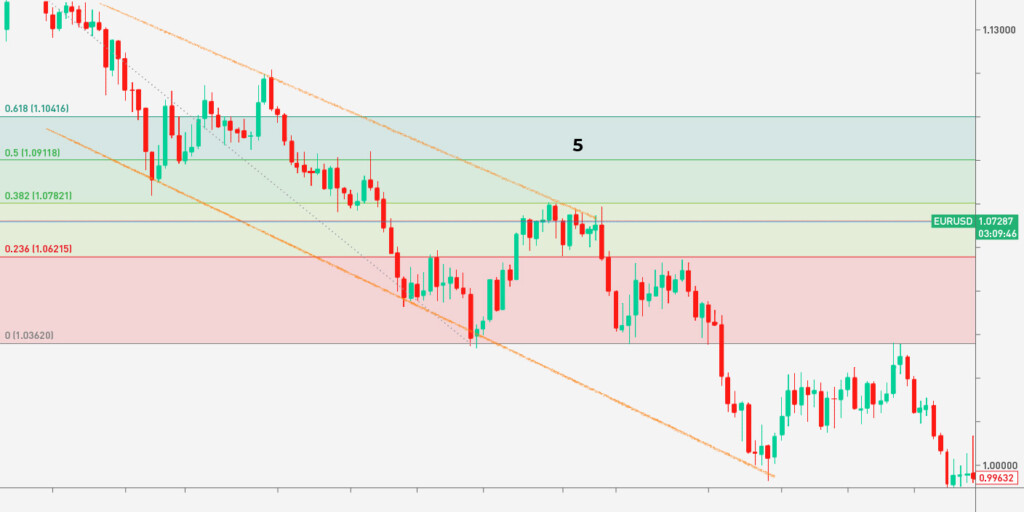
Rule #5: Determine profit targets with trendlines
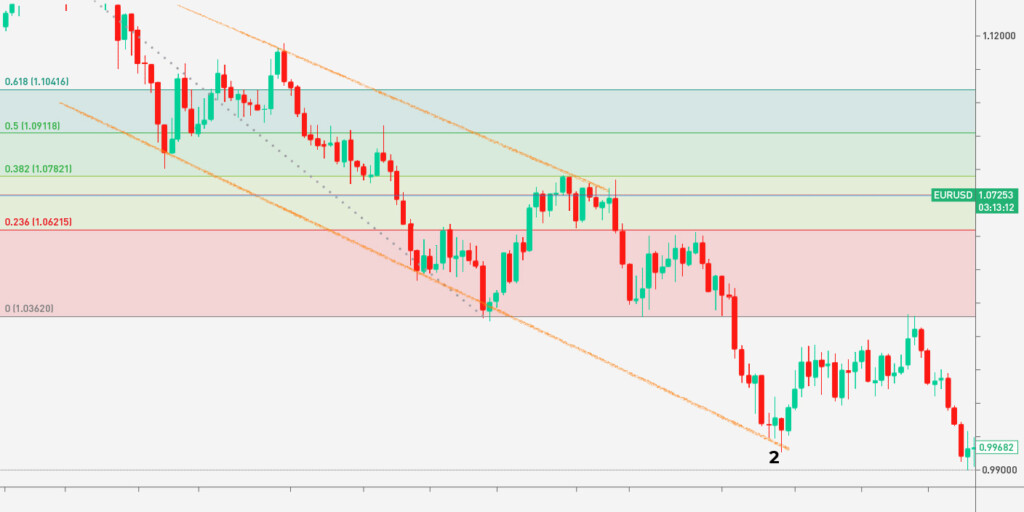
Fibonacci levels will help you identify entry points but won’t determine potential targets. You can draw an opposite trendline of the one the price is supposed to rebound from and use it as a target. Considering the example above, you could draw a support trendline and place the take-profit order at point 2.
Rule #6: Determine profit targets with trend-based Fib extension
Another way to identify a profit target is to use the trend-based Fib extension indicator. Unlike Fibonacci retracements, you will need three swings to apply it to the chart. In a bearish trend, you should connect a swing high, a swing low, and another swing high. In a bullish trend, you will need to connect a swing low, a swing high, and another swing low.
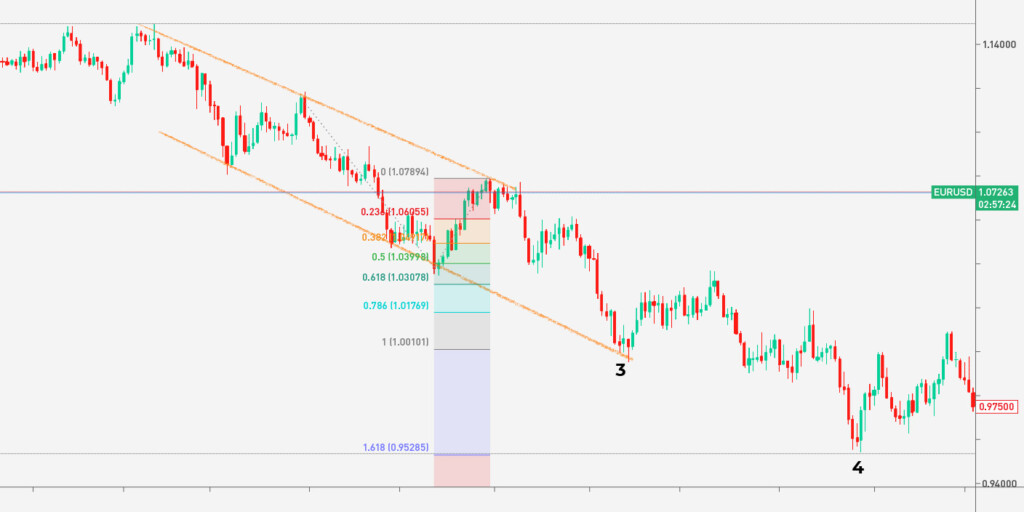
In the chart below, the Fibonacci level of 1 correlated with the lower trendline (3). It could be an additional confirmation of a reliable take-profit target. You could trail the level to 1.618 Fibo level, but it would be risky, as the price barely touched it (4).
Rule #7: Limit risks

The theory suggests that traders place a stop-loss order at the previous Fib level to the one they entered the market at or at a recent price swing. You could consider point 4 at 0.5 Fibo retracement as a stop-loss level.
Takeaway
The concept of Fibonacci and trend line trading is straightforward. The only challenge you can face is an incorrect tool implementation. It’s vital to learn to draw lines. Before you enter a real market, you can examine how Fibonacci and trend lines strategy works on a demo account.
Sources:
What Are Fibonacci Retracement Levels, and What Do They Tell You?, Investopedia
Trendline: What It Is, How To Use It in Investing, With Examples, Investopedia
How to Use Fibonacci Retracement with Trend Lines, babypips.com
Trading with up to 90% profit
<span>Like</span>