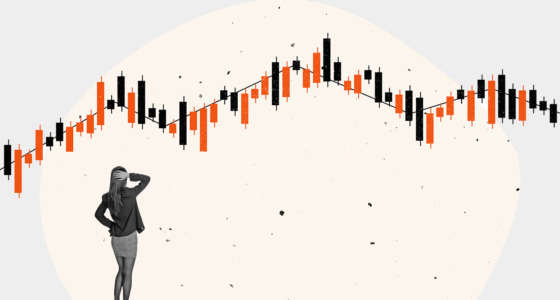

Japanese candlesticks are one of the most popular chart types, along with bars and lines. The reason for their popularity is their simplicity and the importance of the information they provide for traders. Although a candlestick chart is easy to use, it has unique features—by learning about those features, traders will get more reliable and helpful information for their trading decisions.
Start from $10, earn to $1000
Could you imagine that there are over 75 candlestick patterns and 42 recognized chart patterns? The numbers are enormous, but fortunately, you don’t need to learn all of them.
Tip #1: Learn how to read candles
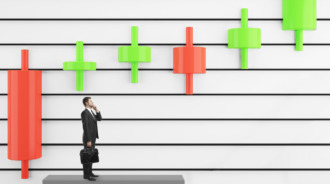
You may know that each candle provides information about open, close, high, and low prices. Candles have particular colors that help traders distinguish between falling and rising prices for each period. This means that you can easily identify the current market direction by looking at the chart. However, that’s not all. You can get the signals not only from the color but also from the candle’s shape.
These common rules:
- A short candle body reflects market indecision, in which neither bulls nor bears can take control of the market.
- A long candle body shows the strength of bulls or bears depending on the location of the closing price relative to the opening.
- A long lower shadow says the bears are losing their strength. The signal is stronger if such a candle appears in a solid downtrend.
- A long upper shadow reflects the weakness of the bulls. The signal is more reliable if such a candle occurs in a strong uptrend.
- A candle without shadows or with one small shadow is called Marubozu. It reflects the strong market trend.
These rules will help you do a quick market review without a comprehensive analysis.
Effective strategies in your mailbox
Subscribe and discover a fund of trading knowledge
Great! Please check your email
We’ve sent you an email to confirm your subscription
Something went wrong
Try reloading the page. If that doesn’t help, please try again later
Tip #2: Learn the most effective candlestick patterns
There are numerous patterns, but not all of them are effective. Moreover, you need to choose those that work for your own strategy. Candlestick patterns can’t be equally effective for scalpers who open up to 100 trades within a day and position traders who keep trades open over weeks and even months. You should find the patterns with good results for a particular strategy.

First, you can start with the most popular formations, including evening and shooting stars, hammer, handle man, three black crows, three white soldiers, etc. If they don’t provide reliable signals for your approach, you can try less common patterns. The idea is to set rules so that candles work for you.
Tip #3: Learn the most reliable chart patterns
There are candlestick patterns and chart patterns. While candlestick formations consist of up to 5 candles, chart patterns include many that make a particular figure in the chart. You may have heard of these formations: double top and bottom, head and shoulders, inverse head and shoulders, cup and handle, and inverse cup and handle.
Trading with up to 90% profit
The idea is the same: you need to choose those that provide the most reliable signals for your trading strategy. Even though there are the most frequent and reliable patterns, they may be ineffective for your trading style. To find the right one, you need to test numerous formations on different timeframes and for different assets.
5 best coffee types for traders
Coffee is a great beverage for traders. A few daily cups of coffee improves the mind and enables you to make better trading decisions. Check it out!
Read more

Tip #4: Learn the frequency of continuation and reversal outcomes
Not many newbie traders know that even if a pattern is considered a reversal, it may signal a trend continuation and vice versa. Before you learn a particular pattern, try to find the information about the percentage of its reversal and continuation signals. If you can’t find any, you can do your own research and use the historical data to identify whether the pattern worked in the past and what signals it provided.
Tip #5: Practice a lot to find patterns
It may sound like obvious advice, but the idea is to get used to different variations of patterns. You should remember that there are no perfect formations in the price chart. Markets are dynamic, and although the price repeats certain movements over time, they can’t be identical. For instance, if the rule says the candle’s shadow should be twice its body, it doesn’t mean you need to calculate the shadow and skip the pattern if it’s a little bit longer or shorter. It’s even more difficult to spot chart patterns as the range of their variations is wide.
Tip #6: Use multiple timeframes
Traders use different timeframes to confirm signals of technical analysis tools. For instance, if the candlestick provides a reversal signal in one timeframe, you can consider a shorter one to determine the precise entry point. Usually, traders use three consecutive timeframes, placing an order in the middle one, evaluating the overall market trend in a longer one, and checking pitfalls for an entry in the shortest one.
Tip #7: Confirm signals
Regardless of the winning rate of the pattern, you need to look for confirmations from other technical analysis instruments or fundamental analysis events. For instance, if a candlestick pattern predicts a trend reversal, you can check whether fundamental events could trigger a change in the trend. Also, you can combine patterns with indicators. Trend and volume indicators can help you determine the probability of a trend reversal.
Takeaway
Candlestick analysis is one of the cornerstones of successful trading. If you learn how to read candles, you will be able to develop a working trading strategy. However, you should keep in mind that there is always a risk of a wrong signal or that you misread it. If the common rules always worked, all traders would have a 100% success rate. Take the time to analyze candlesticks and test your strategy numerous times before you enter the real market.
Sources:
Understanding Basic Candlestick Charts, Investopedia
Introduction to Candlesticks, StockCharts
Earn profit in 1 minute
+2 <span>Like</span>