
Some fractals may captivate people with their beauty in art, with notable fractal artists including Desmond Paul Henry, Hamid Naderi Yeganeh, and musician Bruno Degazio. Even in nature, coastlines exhibit intricacies based on fractal patterns. Beyond their aesthetic appeal, they serve as powerful tools in various domains. For example, they efficiently enhance radio antennas and optimize connections in computer chips.
Amidst these applications, fractals have found their way into trading and the Binomo platform, particularly with the Fractal Chaos Bands indicator. In this guide, let’s explore how this fascinating tool leverages fractal geometry.
What are the Fractal Chaos Bands?
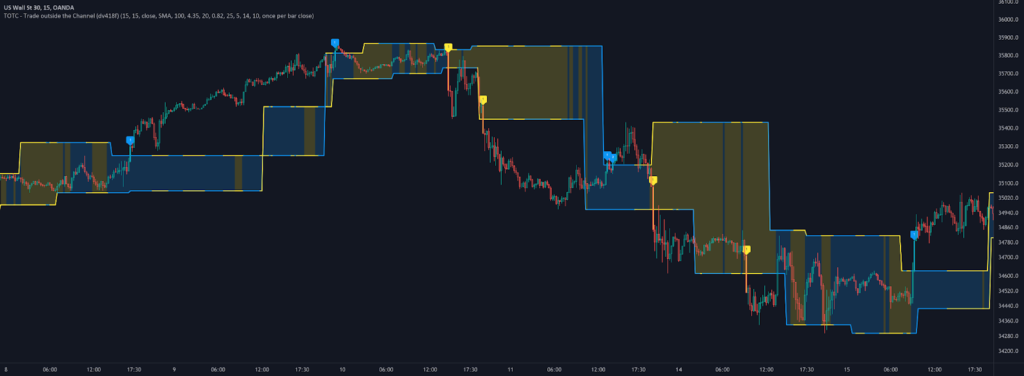
The Fractal Chaos Bands are a technical indicator introduced by an Australian commodity trader and advisor, Edward William Dreiss. These bands are based on the principles of fractal geometry and provide insights into market trends. They serve to filter out insignificant price fluctuations, revealing a distinct pattern. The indicator accomplishes this by connecting the highest and lowest price points within a specific interval, thus forming upper and lower bands.
The upper band is created by connecting the price highs, while the lower band connects the price lows. As a result, the bands essentially follow the movement of the price chart but with a notable distinction — they smooth out the price noise, focusing solely on significant price movements. By observing these bands, traders can easily assess whether the market is in a trending or non-trending phase.
How to read Fractal Chaos Bands
Here is what you can learn by looking at the chart with Fractal Chaos Bands:
- The upper and lower price ranges are particularly useful for short-term trading (e.g., in a Fractal scalping strategy), providing traders with insights into potential resistance and support levels, respectively.
- The slope of the bands plays a key role in determining the market trend. When the market is trending, the indicator will exhibit a noticeable slope, which indicates a clear directional movement in prices.
- If the slope of the bands decreases or becomes nearly flat, it suggests the market is moving sideways and has limited directional movement.
- After a period of trending, if the slope of the bands starts to decrease, it may indicate the market is becoming more volatile. Price movements could be becoming more erratic and less predictable.
How to trade with the Fractal Chaos Bands
As mentioned, a flat band indicates higher volatility, prompting traders to exercise caution. The real opportunity lies in identifying trends. When the bands start moving further apart, resembling stairs, it may signal the beginning of a trend and presents a potentially favorable trading opportunity.
One common strategy to apply with this indicator is the breakout strategy. A buy signal is generated when the price chart moves within a narrow channel and breaks through the upper band from below. The opposite is also true — when the price moves in a narrow channel and breaks through the lower band, it’s associated with a sell signal. To protect your position, in the case of a buy trade, the stop loss can be trailed with the rising fractal line, and if you go for a sell trade, trail the stop loss with the falling fractal line.
You can also apply this logic: when considering long positions, a little upward slope in the indicator suggests a rising asset price. For short-selling positions, you should be looking for a little downward slope in the indicator during a negative trend.

Limitations of the Fractal Chaos Bands
Like most trend-following indicators, the Fractal Chaos Bands exhibit lag, which means they respond to price movements after they occur. This lag can result in missed opportunities or entering positions too late.
In choppy or noisy market conditions, the Bands can generate conflicting signals or false breakouts. So you may want to avoid trading during periods of high volatility or when the market lacks a clear trend. Also, look out for repainting, which is when unconfirmed fractals disappear from the chart if the price moves beyond their levels.
And like with any technical indicator, relying solely on the Fractal Chaos Bands for trading decisions is quite risky. Your trading process will benefit from combining other technical indicators, price action analysis, and fundamental factors for a more comprehensive view of the market.
How to combine Fractal Chaos Bands with other indicators
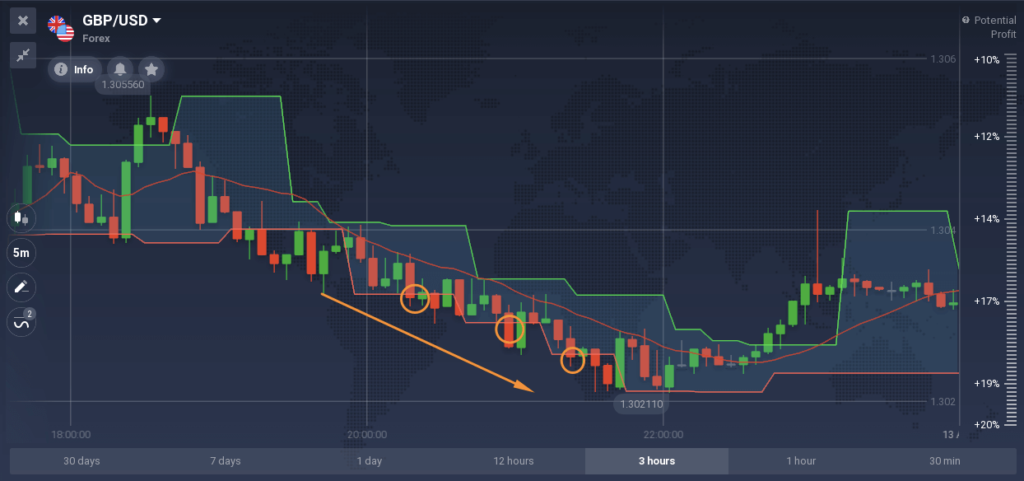
It’s a good idea to combine the Fractal Chaos Bands with a Simple Moving Average for a confirmation of trading signals and higher accuracy of your trading strategy. Here’s how you can combine these two indicators:
- SMA setup — Begin by adding an SMA to your price chart. The SMA calculates the average price of an asset over a specified period, providing a smoothed line that represents the overall trend.
- Confirming buy signals — When the Fractal Chaos Bands generate a buy signal, look for the price chart to cross the SMA from below. This confirms the upward trend and strengthens the buy signal.
- Confirming sell signals — Similarly, when the Fractal Chaos Bands generate a sell signal, you want the price chart to cross the SMA from above. A bearish crossover of the price chart below the SMA acts as a further confirmation for initiating a short trade.
Summary
Putting it all together, the Fractal Chaos Bands indicator offers a straightforward means to discern market trends versus choppiness. Fractals prove to be a versatile support tool, complementing various trading methods, so consider trying out the Fractals indicator on Binomo.
To optimize its potential, strongly consider combining the Fractal Chaos Bands with other trend-following indicators. This will allow you to confirm breakouts or breakdowns in the market and navigate the complexities of the financial markets with greater confidence.
Sources:
Fractalchaos — Indicators and Signals, TradingView
Fractal Chaos Bands (FCB), Stock Indicators for .NET
