
If you wonder why professional traders use technical indicators, there are at least two reasons. First, many technical indicators were developed by experienced traders. Second, if professional traders didn’t use indicators, technical analysis wouldn’t exist.
However, there are skeptics, and Princeton economist Burton Malkiel is one of them. He claimed that technical tools must be self-defeating: “The problem is that once such a regularity is known to market participants, people will act in such a way that prevents it from happening in the future.” It stands against the core technical analysis concept — trends repeat themselves.
Let’s find out what kinds of traders rely on technical tools.
Earn profit in 1 minute
Technical and fundamental analysis
There are two types of analysis — technical and fundamental. A common recommendation is to combine two approaches. However, some traders rely either on fundamental factors or technical analysis.
Fundamental analysis is an approach that implies using fundamental factors such as news, economic data, and financial reports to predict a price direction. Fundamental analysis is mostly used by long-term traders. For example, stock traders study financial reports, business goals, current industry conditions, and overall macroeconomic factors to determine whether a company will grow or suffer.
Also, fundamental analysis can be used by short-term traders who prefer trading on low timeframes and high volatility caused by news releases. For example, the Fed’s interest rate decisions cause high volatility in bitcoin’s price before and after the release.
However, short-term traders can’t trade without technical analysis because fundamental factors can determine good entry and exit points.
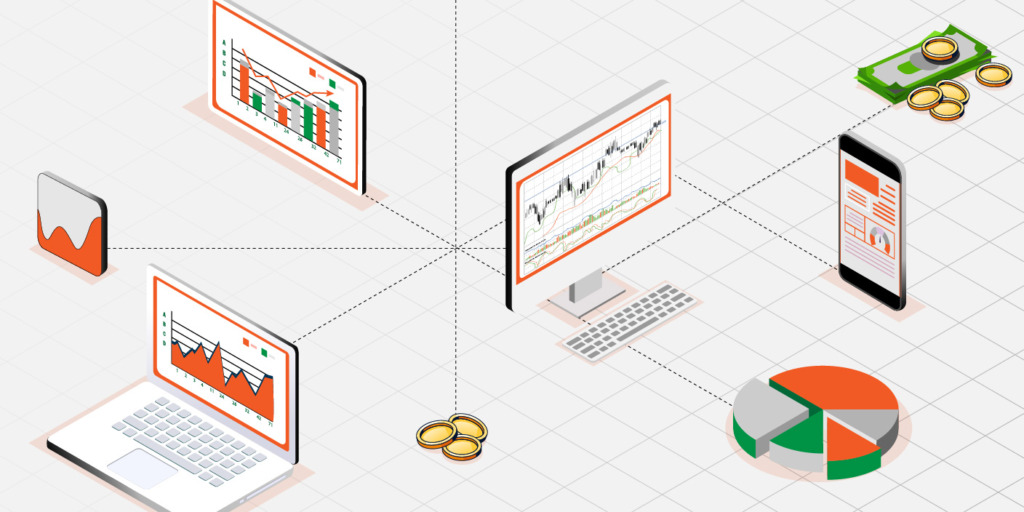
Technical analysis allows traders to determine entry and exit points based on indicators, chart patterns, and support/resistance levels. Technical indicators provide vital information, including the strength of bulls and bears, a level of volatility, overbought and oversold market conditions, and the strength of price movements. They allow traders to analyze the market fast. It takes several minutes to add an indicator to a price chart and evaluate the signals it provides.
Effective strategies in your mailbox
Subscribe and discover a fund of trading knowledge
Great! Please check your email
We’ve sent you an email to confirm your subscription
Something went wrong
Try reloading the page. If that doesn’t help, please try again later
What traders use technical indicators
Not only short-term traders use technical analysis. There are other types of traders that consider indicators as effective tools.
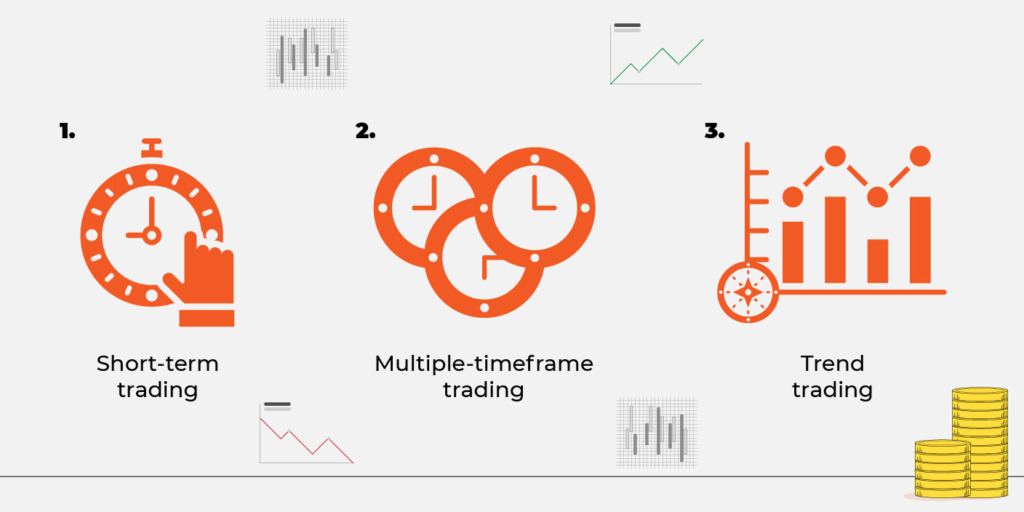
1. Short-term trading
Scalpers and day traders trade on low timeframes. They must react to constantly changing market conditions fast. To enter and exit a trade at perfect points, they need to identify levels where the price will likely turn around.
The levels can be determined with technical indicators. Also, traders can’t evaluate by themselves whether an asset is overbought or oversold or whether bulls and bears are strong, but indicators can.
2. Multiple-timeframe trading
Some traders trade one asset on different timeframes simultaneously. Even if a trader determines support/resistance levels on one timeframe, these levels won’t work on another. Volatility in one timeframe won’t correlate with volatility in another. Therefore, traders apply technical indicators on different timeframes.
3. Trend trading
You may wonder why trend traders need technical indicators when trends are visible without additional tools. However, without indicators, you may enter an ending or a weak trend. Therefore, you need indicators that reflect how strong the trend is, how long it has lasted, and how long it may last.
Trader’s level test
Answer 7 short questions and define your level as a trader. Take the test now to evaluate your real knowledge!
Start test

What indicators do professional traders use?
You may find numerous articles telling what indicators professional traders use, but there is no such list. Traders choose indicators based on assets they trade, timeframes, the number of assets they have, frequency of trades, etc.
Most of them will use traditional indicators such as relative strength index, moving averages, moving average convergence divergence, Fibonacci levels, volumes, and Bollinger bands. These tools have proved their reliability. However, it doesn’t mean they can’t implement other indicators such as Alligator, Awesome Oscillator, Average True Range, or Stochastic. Also, some professional traders develop their own indicators.
professional traders develop their own indicators.
The most popular indicators used by professional traders include:
· Moving Averages
Some of the most popular indicators for creating a trading strategy are the moving averages. With a moving average, traders have an easier time determining a trend and locating the best trading opportunities. For example, if you have an uptrend in the market, you may use moving averages to determine the trend and find the perfect moment to buy and sell.
The moving average often appears as a plotted line. This line will measure the price of a currency over a certain timeframe. For example, you may use the moving average on the last 300 days to determine the overall direction of a price.
· Bollinger Bands
This indicator is used for in-day trading and it’s like an upgrade of the moving average. It is comprised of three lines: the moving average, the lower limit, and the upper one. Based on how they move together, you should be able to make the right trading decision.
These lines represent the standard deviation of a certain stock. In other words, it’s the amount by which a price would decrease or increase based on its average. This would give day traders an idea of the trading range of a specific stock.
· Momentum Indicator
Momentum indicators help traders get an understanding of the rate or speed at which a specific security may change. They don’t necessarily show the direction of the movement, but the timeframe in which they occur. This is why they are often used in combination with other indicators, to get an understanding of the price direction.
There are several momentum indicators that a trader may use. One is the relative strength index (RSI), and the other is the moving average convergence divergence (MACD). Each momentum indicator will show the weaknesses or strengths of a certain price, allowing you to come up with a decision.
· MACD
Your moving average convergence divergence tells you exactly where the trend direction is and what momentum that trend had. At the same time, it will give you several trade signals that you may use. Based on the price, you may either decide or sell.
When your MACD goes below the zero point, then it means it has entered a bearish time. On the other hand, if it goes above zero, then it means it has entered its upward phase. Both points are relevant when creating a strategy.
This indicator is made out of two lines: the signal line and the MACD line, with the signal line moving slower. If the MACD line goes below the signal line, it means that the price of that asset is falling. On the other hand, if the MACD line goes above the signal line, it means that the price is on the rise.
· Relative Strength Index (RSI)
Relative strength indexes (RSI) are oscillators that are quite simple in their application. They will help you determine if a specific currency is overbought or oversold. This way, you can expect a reversal. If you are the kind of trader that likes to sell high and buy low, then the RSI is one of the top indicators you will need.
A relative strength index can be very useful in ranging and trending markets, helping you find the best entry and exit price. Trends may vary, but once the indicators recover from the extremes, it helps you determine what the best trend is. Depending on the value you see in the trend, you can create a strategy.
· Volume Indicator
Volume indicators will look at the negative and positive flow of volume for a specific security over time. It will tell you the number of times that a specific asset was traded over a certain timeframe. It is one of the most popular indicators, which suggests when a price may fall or go on the rise.
If the volume is up, then it means there were enough sales during the day to rally the price. That being said, if the volume is down, it suggests that the prices have fallen. When the volume reaches a higher level, it suggests that the buyers are willing to step in, pushing the price even higher. If it’s low, it suggests the asset is more often sold than bought.
A volume indicator can work as a tool for trend confirmation. If your strategy involves following trends, this indicator can help you follow it and make the right decision at the right time.
Takeaway
Professional traders use technical indicators, especially on short-term timeframes. Indicators provide buy and sell signals and help traders evaluate market conditions quickly. They are calculated automatically and change every time the asset’s price changes. This makes them a necessary tool.
Start from $10, earn to $1000
<span>Like</span>