
Technical analysis is vital in price prediction, even if you prefer using fundamental events.
Technical analysis is one of the trading disciplines applied to measure investments and determine trading opportunities through trends and patterns on a price chart.
Most technical indicators and patterns were created decades before the cryptocurrency market appeared. Therefore, traders’ most frequent question is whether standard technical tools work for cryptocurrencies. Yes, they do. However, you should learn the unique features of the cryptocurrency market to use them effectively. Let’s discover the most suitable indicators and candlestick patterns for crypto.
Earn profit in 1 minute
What Is Technical Analysis?
Technical analysis is the process of studying price actions, chart patterns, indicators, volume, trends, and many more. With this data, investors can predict the future, calculating the potential ways in which the market can fluctuate.
Technical analysis has a decent degree of accuracy, but because of the volatile nature of the stock market, patterns may also fail. Used correctly, technical analysis can increase the probability of a trade being profitable, but it will certainly not guarantee it.
Effective strategies in your mailbox
Subscribe and discover a fund of trading knowledge
Great! Please check your email
We’ve sent you an email to confirm your subscription
Something went wrong
Try reloading the page. If that doesn’t help, please try again later
Will Technical Analysis in Crypto Grow into the Same Mature Phase as in Traditional Markets?
Technical analysis can be applied to any market – cryptocurrency included. The main issue is that, unlike traditional markets where you have more stability, crypto is much more volatile. And a volatile instrument is considered a much higher risk compared to the non-volatile type.
The advantage is that you may also get much better returns. Traditional markets have slow and steady growth, but crypto has the potential of going through the roof in a short time. It mainly depends on investors and how they react to the market.
At the moment, technical analysis works much better with the stock market, since it has a bigger pool of available data. That being said, automatic trading made it much easier for traders to think fast and put the best strategies in motion. It all depends on how much attention you pay to the crypto market.
As long as the technical indicators are interpreted correctly, technical analysis in crypto has the potential of maturing significantly.
Crypto Technical Analysis Tools
Technical analysis works best when quality tools are used for this purpose. Here are the most common tools used to gather reliable crypto data:
Start from $10, earn to $1000
· Japanese Candlesticks: These are price charts that are shown in a line, showcasing the rise and fall of a specific price action.
· Moving Averages: These tell traders how the price is likely to move over a certain period. Can signal when it is the best time to buy or sell an asset.
· Support and Resistance: Interest areas where you are more likely to find orders. They may include areas where strong prices were found in the past.
· Uptrends and Downtrends: They define a series of highs and lows of an asset, suggesting that prices are either going higher or reaching the bottom.
· Time Frames: Signify whether an asset is going through an uptrend or downtrend. Higher time frames may suggest downtrends whereas lower timeframes suggest the opposite.
· Relative Strength Index: An oscillator that tells traders if an asset is being overbought or oversold. Readings over 70 indicate overbuying and below 30 indicate overselling.
· Trading Volume: It represents the total asset shares that were traded on any day. This includes both buying and selling.
· Market Cap: It represents the total value of every asset that has been mined. In this case, it is the number of coins in each market cap category.
By combining all of these technical analysis tools, you may create a good trading plan. By using data to predict the future, you should be able to make the right trades.
How to start trading with $200 and minimum risk
Don’t let a small budget deter you from trading! Learn how to start trading with $100 or $200 and make the most out of this money!
Read more

Do indicators work for crypto?
Yes, indicators work for crypto if you know what indicators to use and on what timeframe to implement them. If you are a newbie trader, you should trade on longer-term timeframes. Longer periods allow you to determine the current trade and make a decision without needing to hurry. The most effective technical indicators for cryptocurrency trading are MACD, RSI, support and resistance levels, Bollinger Bands, and volume.
- MACD. The MACD indicator works better on higher timeframes because it’s based on the moving average, which is a lagging indicator. This means it provides signals with a delay. As the cryptomarket is highly volatile, you risk missing a good signal. You are recommended to use the MACD tool on lower timeframes only when looking for convergence/divergence.
- RSI. This indicator is also lagging. Therefore, you should apply it on higher timeframes. Be ready for the RSI line to cross oversold/overbought zones multiple times due to high price fluctuations. Evaluate the market and confirm RSI signals.
- Bollinger Bands. This tool will help you predict price reversals. However, you should consider that the price may move beyond the bands due to high volatility.
- Volume. The volume indicator will allow you to measure buyers’ and sellers’ strengths. This indicator is suitable for all assets.
- Support and resistance levels. This is the most effective tool you can use for the cryptocurrency market. Place the levels based on closing and opening prices and be ready for the price to go slightly beyond them.
Do candlestick patterns work for crypto?
The cryptomarket is highly volatile. Therefore, more candlestick patterns appear on it than on more stable markets. Your challenge is to read their signals correctly and distinguish fake signals from real ones.
How to read candlestick patterns in cryptocurrency
You need to learn how patterns look to read their signals. The price may change its direction too fast. Therefore, you must react without delay. If you start looking for pattern descriptions on the Internet, you will waste time and miss a good entry point.
As cryptocurrency differs from traditional markets, you shouldn’t take risks. The best candlestick patterns for crypto are the standard patterns. These are those that traders frequently use. Below, you will find the most popular and reliable candlestick patterns that will work for digital currencies.
The second important step is to confirm pattern signals with indicators. The cryptocurrency price suffers significant fluctuations. Therefore, you should be sure the alert still makes sense. The most reliable tools for beginners to confirm signals of candlestick patterns are RSI, MACD, Awesome Oscillator, and Stochastic. However, they are more reliable on long-term timeframes.
Do chart patterns work for crypto?
Any chart pattern will work for crypto if you learn how to measure price volatility. Enormous cryptocurrency volatility may leave you with losses if you place a stop-loss order too close to the entry point.
Every chart pattern has specific rules that determine an entry point and a potential target. Your aim is to define where to place the stop-loss level. The traditional risk/reward ratio sometimes doesn’t work because the price forms too-long shadows. You should measure the length of previous shadows(no numerical calculations are required). The idea is to determine the average price fluctuations and set an appropriate stop-loss boundary.
Another point may sound confusing, but you should know how patterns work.
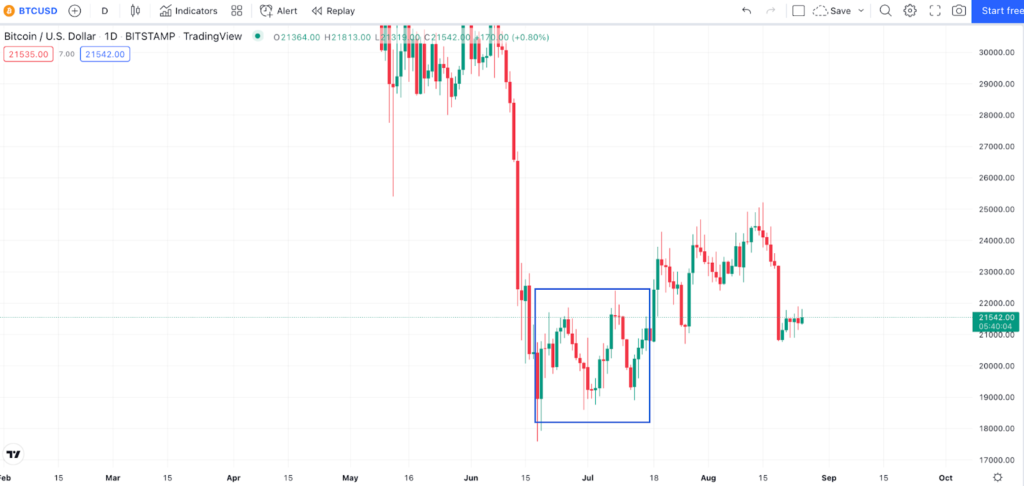
The price movement on the daily chart of BTC/USD looks like a double-top pattern. However, as you may know, the pattern appears at the end of an upward movement. Therefore, this is not a double-top pattern.
Final thoughts
Technical analysis will work for cryptocurrencies if you pick the right tools. There are numerous indicators and candlestick patterns for cryptocurrencies. You should start with traditional ones to be sure they don’t fool you. Moreover, you should avoid making too many short-term trades, as cryptocurrencies are a subject of enormous volatility. Only experienced investors can deal with them.
Trading with up to 90% profit
+1 <span>Like</span>