The Engulfing candlestick pattern is one of the indicators used most frequently in technical analysis. Two candles make up this pattern, which can reveal important details regarding trend reversals. The fundamentals of the bullish and bearish Engulfing patterns will be covered below, along with tips on trading with them.
Earn profit in 1 minute
What is the Engulfing candlestick pattern?
The Engulfing candlestick pattern is a common indicator used by traders for technical analysis. In this pattern, the previous day’s candle is dominated or engulfed by the next day’s candle, which has a lower low and a higher high. Essentially, there are two types of Engulfing candlestick patterns: bullish and bearish.
Bullish Engulfing pattern
The bullish Engulfing pattern is characterized by the first candle being a red or black candle and the candle on the following day being green or white. The next day’s candle should open lower than the prior candle and close at a higher point for the bullish Engulfing pattern to form correctly.
The bullish Engulfing pattern comes into the category of two-candle reversal patterns. You should look for this pattern when the market is in a downtrend (the bears are in control) since it should come near the end of that trend to signal its reversal.
The size comparison must be made based on the real body of the candle, not the shadows. For the bullish Engulfing pattern, shadows must be ignored.
Bearish Engulfing pattern

In the bearish Engulfing pattern, the first candle is green or white, and the second is red or black. The real body of the second candle is longer than the real body of the first one, both at the day’s opening side and the day’s closing side.
This pattern appears most commonly when the price is seeing an uptrend and the bulls are in control. When this pattern forms, it suggests that a trend reversal is incoming, and the bears are now in control of the market.
In the bearish Engulfing pattern, the shadows or wicks of the candles are ignored since the formation of long wicks is common on days when both bulls and bears are struggling hard to gain control of the market.
Effective strategies in your mailbox
Subscribe and discover a fund of trading knowledge
Great! Please check your email
We’ve sent you an email to confirm your subscription
Something went wrong
Try reloading the page. If that doesn’t help, please try again later
Importance and Limitations
The importance and advantages of the Engulfing candlestick pattern come from its ease of use, clarity, and contextual information. Unlike many patterns like the Head and Shoulders pattern, it doesn’t take multiple days to form and comprises only two candles which are easy to spot due to their difference in size. Furthermore, it provides a very clear indication that the trend is about to reverse, and it tells you when the market context is changing due to changing sentiments of traders.
However, the Engulfing candlestick pattern has its limitations. It can sometimes give you false signals, especially when the market is choppy, i.e., no significant price change over a few days. Therefore, using other candlestick patterns or technical tools in conjunction with the Engulfing candlestick pattern is necessary to avoid losing your funds.
How to start trading with $200 and minimum risk
Don’t let a small budget deter you from trading! Learn how to start trading with $100 or $200 and make the most out of this money!
Read more

How to trade the bullish Engulfing pattern?
For our example, we will use Tesla’s chart, where the price is shown in USD.
As you can see from this chart, the stock price had consistently fallen in December 2022. On January 5th, 2023, we see a small red candle; the next day, a big green candle engulfs the previous day’s candle.
It opens at a lower low, which means that the day started with the bulls being in control and pushing the price down, and it ends at a higher high, which shows that the bulls had gained control of the market by the end of the day.
When the pattern formed, the price was around $113, and we saw a whopping increase of a little more than $100 by February 17th. Traders who knew about the bullish Engulfing pattern probably made a hefty profit.
How to trade the bearish Engulfing pattern?
We will use the same chart for the bearish Engulfing pattern for consistency.
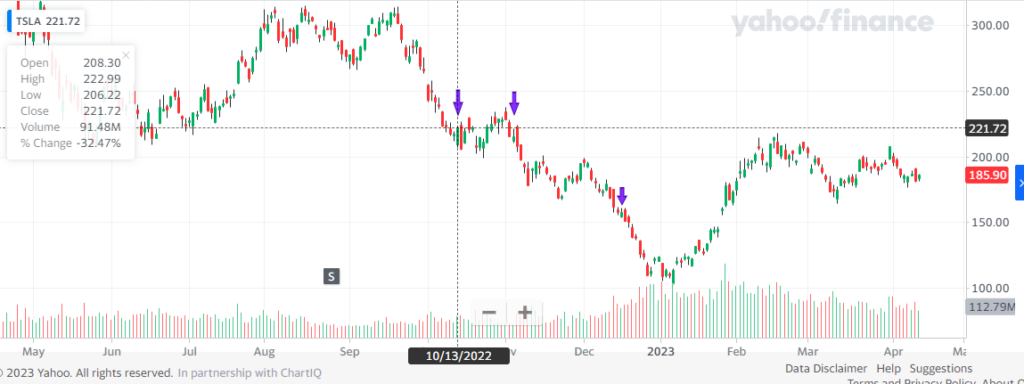

This example is slightly more complex since we can see three bearish Engulfing patterns identified by the candles. The first appears on October 13th-14th, with the first candle being a long green candle and the second being an even longer red candle. It suggests that the bulls were close to rallying the price for an uptrend, but the bears got the better of them in the end.
The competition was quite close, and the bulls weren’t willing to let the price fall that easily. We can see that the price action continued to be pretty choppy for the next few days. However, the bearish Engulfing pattern reappeared on the 3rd-4th of November. This time, the green candle was short, followed by a big red candle, a more unambiguous indication of the oncoming downtrend.
The second pattern predicted a more successful bearish market, and the price continued to fall in step. The bearish Engulfing pattern’s reappearance on the 15th-16th of December indicated a fall continuation, after which the price kept dipping. The price fell from $219 (the appearance of the first bearish Engulfing pattern) to roughly $113.
The bottom line
An Engulfing candlestick pattern is an effective tool for traders looking for trend reversals. It is simple to use and offers unmistakable signals of market attitude. As with many technical indicators, it has its limits. Therefore you should combine it with other instruments to avoid misleading indications.
Start from $10, earn to $1000
<span>Like</span>