The Gann Fan exploits the geometric and cyclical nature of the market. The concept is based on angles. In this article, we will talk about the person who created this indicator, how to use it in trading with real examples, and its pros and cons.
Start from $10, earn to $1000
Who was the creator of Gann Fan?
Gann Fan was originally the brainchild of an early market technician W.D. Gann. His strategy is based on a 45-degree angle, which seems to be the ideal angle for charting. His theories are based on the balancing of the two important factors in the market, and those are time and price.
W.D. Gann mastered his trading strategies by utilizing his knowledge of geometry, ancient mathematics, and astrology. His legacy of trading was spread over a vast canvas of more than 50 years.
He started trading in the year 1900. He mastered the art of predicting assets’ top, bottom, and future price movements. His techniques, known as Gann indicators, are used even today in various technical analysis tools and have been integrated into modern-day trading platforms.
Effective strategies in your mailbox
Subscribe and discover a fund of trading knowledge
Great! Please check your email
We’ve sent you an email to confirm your subscription
Something went wrong
Try reloading the page. If that doesn’t help, please try again later
Understanding Gann Fan
The strategy used by Gann is based on the concept that the markets revolve around angles. The shifting from one angle to the other dictates the price action. These angles, when planned out in sync on a chart, are what make the Gann Fan.
Before moving ahead, let’s understand a few terms used by this strategy.
Gann Angles

The geometrical angles started from zero and went towards 360 degrees in a positive or a negative direction. Gann formulated his basis on the 45-degree angle. He considered it the most important, but the Gann also draws angles at 82.5, 75, 71.25, 63.75, 26.25, 18.75, 15, and 7.5 degrees. When joined in a connected series, these angles form the wings of a fan called the Gann Fan.
Gann covered these angles in his book The Basis of My Forecasting Method, written in 1935. By superimposing nine angles over a price chart, Gann shows potential support and resistance levels where each of the nine Gann angles represents a price movement. The angles will be more evident in Figure 1, given below.

Gann Fan
The Gann fan consists of a series of angled lines, as shown in Figure 2 below.
The trader does a section of the starting point on a graph, and the lines extend into the future. This entire notion of technical analysis through Gann Fan is based on the fact that the market is geometric and cyclical.
The Gann fan consists of a series of lines called Gann angles. These angles are superimposed on the price chart to show potential support and resistance levels. The resulting image should help predict price changes.
Charting
Various types of price actions are being prepared these days. These angles are superimposed over a price chart to show the potential support and resistance levels. The resulting image should help predict future price changes.
Gann Fan indicator
Gann designed this indicator after a long study and experience. The most significant advantage of this indicator is its usage of a diagonal approach instead of the usual horizontal approach when determining support and resistance levels.
These Gann angles provide analysis and trading tools used to measure critical elements of trading, such as pattern, price, and time. The Gann strategy is still relevant and used extensively to analyze an asset’s price direction.
When analyzing or trading the course of a particular market, the analyst or trader tries to get an idea of where the market has been, where it is about to trend at the former bottom or top, and how to use the information to forecast future price action. Thus, these Gann fans become a bedrock solution to ascertain these changes.
Note! The Gann Fan, as a separate indicator, will not yield the desired results. Only when combined with other indicators, signals, etc., enable a trader decide about future price action.
Mastering Gann Fan indicator
It is a geometrical analysis; Gann Fan doesn’t require learning or using a formula. The requirement is only to understand the angles and the related slopes in degrees.
Trading with up to 90% profit

Imagine that you are using graph paper which has a lot of squares. Consider each square as one square time frame measured on a horizontal plane. If the price moves up towards the top of the box, then a line can be drawn from the bottom left to the top right of this square. This diagonal line formed by joining the two ends is called the 45-degree or 1/1 line.
Now, consider that this price rise involves two boxes kept horizontally together. Then the same will be termed as 2/1 or 2:1. The angle, in this case, will be much flatter than the 45 degrees.
In a different scenario, if the price rise involves two boxes kept vertically, one above the other, it will be termed 1/2 or 1:2. The angle, in this case, will be much steeper than 45 degrees. Using this analogy, the Gann fan incorporates angles based on the relationship between the price and the time. Thereby, the ratios move in this manner: 1:8, 1:4, 1:3, 1:2, 1:1, 2:1, 3:1, 4:1, and 8:1.
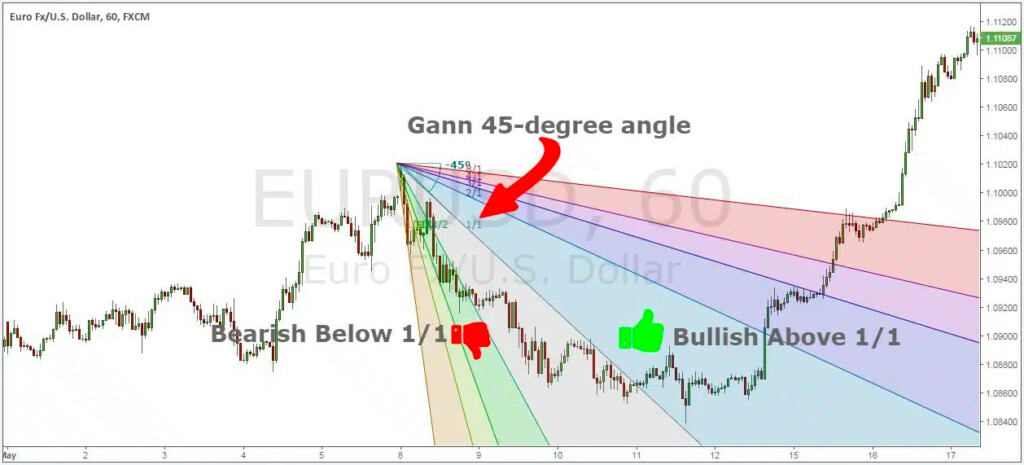
Gann Fan draws these angled lines above and below a central 45-degree line to determine the price direction and strength. These fans are drawn from a central 45-degree angle line extending from a specified trend reversal level. The traders normally draw a Gann fan at a reversal point to ascertain the support and resistance levels and their extension to the future.
7 golden rules of trading
Everyone has their own trading style, but some principles are critical for success. Make sure you’re following these basic rules of trading.
Read more

Drawing the Gann Fan angles
Now that you have seen the mechanism behind the Gann Fan. Let’s now see how to draw them on a trading platform. As you know, the notion behind the Gann Fan is the sync between the price and time. Thus the 45 degree becomes your baseline.
The trading platform you use will have a tool (normally called the trend angle tool) to insert this 45-degree angle, as given in the following diagram.
Once you have found the tool, find a suitable pivot point to place your origin point. You may select the upward or downward pivot point. Draw the Gann Fan towards swing low or swing high based on your point of origin. Draw a perfect 45-degree line from the point of origin.
Understand the trend tool well to start drawing your Gann Fan. The method differs from platform to platform. Now pick the Gann indicator and place it on the graph. Ensure that the overlay matches the 45-degree line drawn by you. That’s it, and you are all set to predict the future price.
Note! Remember that the line above the 45-degree line determines the bull market; below it will determine the bear market.
Trading rules for the Gann Fan strategy
There are many theories and methodologies formulated for working with Gann Fan. We offer trading rules for a long trade using the Gann Fan strategy:
- Find the highest High and draw the Gann Fan based on this point. Watch the 1/1 line carefully and wait for the 1/1 line to break on the upper side.
- Once it has crossed the 1/1 line, wait for the opportune time to buy. The buying point will come once the break happens on the 2/1 Gann Angle. This is essential because the confirmation of reversal only comes at this point.
- Now that you have bought the asset, it is time to determine the stop loss. Now place the Gann Fan indicator on the swing low, which was immediately before the breakout above 2/1.
- Having set the second Gann Fan, set the protective stop loss. Try to place it below the most recent swing low. This should ideally align with the point from where you drew the second set of Gann Fan angles.
- Last and final is to take the profit. In an ideal situation, you should take the profit once the 1/1 line is broken.
The same strategy can be reversed while locating the lowest low on the chart.
Limitations of Gann Fan

The market today is moving very fast, and the trends in the foreign exchange market and Exchange Traded Funds (ETFs) underline the need to revisit at least some of the construction rules and application concepts of Gann Fan.
Technical analysts carry out a lot of debates on the efficacy of this being used as an indicator. One of the points highlighted is that the past, the present, and the future all exist simultaneously from a Gann angle.
Regarding drawing this in a trading platform, some do not provide the mechanism to prepare the 45-degree line at a proper 45-degree angle of the chart. Another limitation of the concept is that different assets usually have different prices and may not scale at the 1:1 ratio. Then it becomes difficult to utilize this tool as it is based on a standard scale.
The traders also face an issue that the Gann Fan is not helpful while applied on multiple charts. The price may stay between the levels and not break them. The angle lines may lack to mark the significant support or resistance levels, and the price may disregard the fan levels.
The fan lines diverge over time, making the distances between the lines huge. These distances may not allow the indicator to function for trading purposes.
The highlighted issues are there, but if applied with other tools and indicators, the Gann Fan for long trade still offers an effective method to utilize it profitably on modern digital platforms.
The bottom line
The trading strategies and theories formulated by W.D. Gann are still relevant and widely used. The Gann Fan, though created with a cumbersome process in the 20th century, is still straightforward to use. Its most significant advantage is the diagonal angles, which unlike horizontal, provide a better opportunity to highlight the swinging trends.
The overlays are almost instant and thus make the viability of Gann Fan more effective if used in conjunction with other tools. The process of drawing the fan and the mechanism behind its usage have been well explained above. Try it to find out whether it is an effective tool or not. But remember that trading is a risky business, and funds must be invested after due caution and learning.
Earn profit in 1 minute
+1 <span>Like</span>