In economics, the Gini index is regarded as a measurement tool for deciphering an income, wealth, or consumption disparity amongst the masses of a particular country or region. In this article, we will explain what the Gini index is and look at its global relevance.
Earn profit in 1 minute
What Is the Gini Index?
Corrado Gini, an Italian statistician, demographer, and sociologist, developed the Gini coefficient in 1912 to measure income inequality in countries. It would be safe to assume that the Gini index helps measure the economic inequality amongst the masses across the globe. The data can also be represented through a graph with the help of the Lorenz curve.
The World Bank defines the Gini index as an index that measures the extent to which the distribution of income or consumption among individuals or households within an economy deviates from a perfectly equal distribution.
A Gini index of 0% (or 0) represents absolute equality. However, if it equals 100% (or 1), it implies absolute inequality. Now let us first understand the Gini index in detail.
Effective strategies in your mailbox
Subscribe and discover a fund of trading knowledge
Great! Please check your email
We’ve sent you an email to confirm your subscription
Something went wrong
Try reloading the page. If that doesn’t help, please try again later
Understanding the Gini Index
The Gini index offers a summarized measure of the degree of inequality among a country’s population. As a coefficient, 0 represents perfect equality, and 1 illustrates perfect inequality. In this kind of measurement, a value greater than 1 is also possible, meaning negative income/wealth in a household.

The coefficient of 0, in the literal sense, means equal income for the entire population of a country; the coefficient of 1 means one individual earns the entire income and the rest have no income.
The Gini coefficient is also used for wealth distribution, which is rarely used due to data availability but is rendered as the Wealth Gini Coefficient.
In economics, the Gini coefficient is viewed as a measure of statistical dispersion used to depict the income/wealth/consumption inequality within a country or a social group. The difference between income and wealth is taken as a measure of the Gini coefficient wherein the income coefficient might be less in a particular country, but the wealth coefficient might be very high.
Therefore, considering it to be an absolute measurement of income or wealth will not be correct. The two countries may have the same Gini coefficient, even with one being the highest-income country and the other being the lowest, as long as the income distribution is equal.
Note! The Gini index is used not only in the economy. For example, you can learn what the Gini index in the decision tree is when you study Python.
Example
As per the World Bank data, the Gini сoefficient of the UK and Mauritania stands at the same level of 32.6. However, if we compare the GDP of both countries in 2022, we can see a huge difference, with Mauritania having a GDP of only 10,375.46 USD compared to the UK, which has a GDP of 3,070,667.73 USD.
The data of other countries, as per the World Bank, shows the Gini сoefficient in Brazil – 52.9, the United States – 39.7, the Russian Federation – 36.0, India – 35.7, and Germany – 31.7.
Representing Gini Index on a Graph

The Gini index is usually depicted graphically through the Lorenz curve. It shows income/wealth distribution by plotting the cumulative income on the vertical axis and population percentile by income on the horizontal axis.
Start from $10, earn to $1000
The Gini index ranges from 0 to 1. A lower index (with a small area A) indicates a more equal income distribution. A higher index (with a larger area A) indicates a more unequal income distribution.
Trader’s level test
Answer 7 short questions and define your level as a trader. Take the test now to evaluate your real knowledge!
Start test

How To Calculate The Gini Index?
The Gini index is calculated by dividing the area between the Lorenz curve and the perfect equality line by the total area under the perfect equality line.
All this can be represented by a simple formula:
Gini Index = A/(A+B),
where:
- A – the Lorenz curve;
- (A+B) – total area under the perfect equality line.
The Gini Index Around the World
The Gini coefficient has sustained growth during the past two centuries. History shows that the pandemics have affected the Gini index to a great extent. As per the World Bank, during the Ebola and the Zika pandemic, there was an increase of about 1.5 points in the following five years.
As per the 2023 data, the global average Gini Coefficient is 38, and Human Development Index is 0.7; this is the global data.
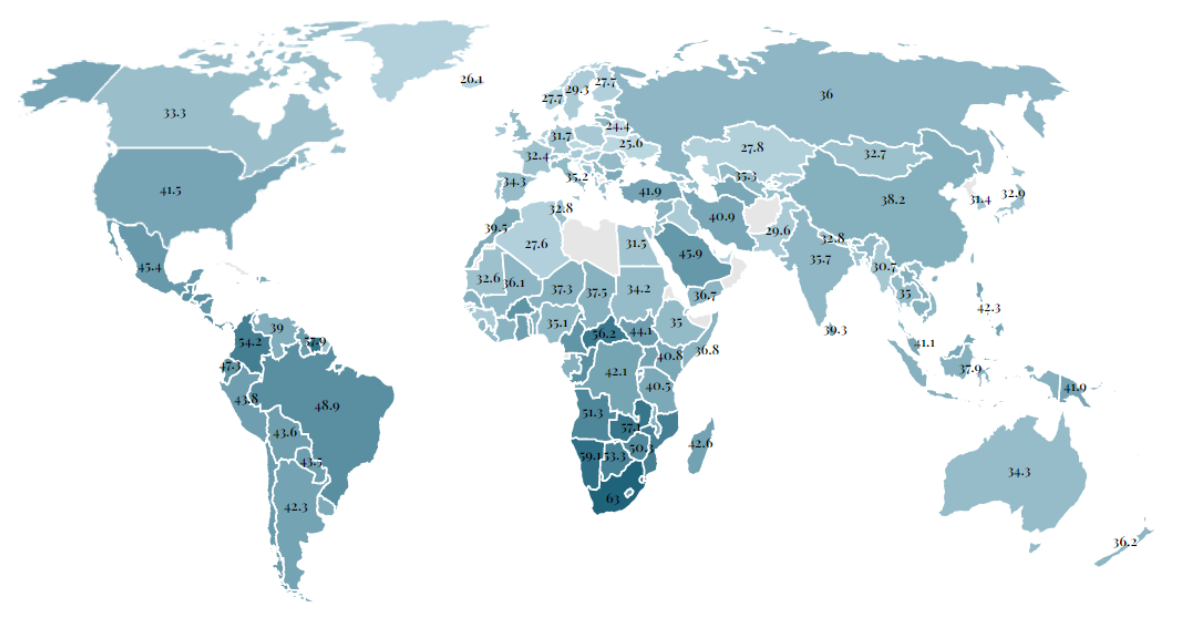
Global Comparison of the Gini Index
As seen in the above map, the variation of the Gini index is vast. Starting from the highest being 63 in South Africa to the lowest at 23.2 in Slovakia. But this does not show the economic prosperity of a country, which is why economists take due care and compare it with other economic data such as the GDP, consumption, investments, money supply, etc.
Limitations of the Gini Index
Despite being a valuable tool for analyzing economic inequality, the Gini coefficient has some shortcomings. The accuracy of the metric depends upon the reliability of the data, which gets affected due to the involvement of informal economic activities.
Gini overlooks the shape of the inequality curve and tries to define it by a definite number. This may lead to depicting similar coefficients despite having different income distributions.
One more unattended aspect is the demographical variation within a group. All these need to be factored in to ensure getting correct data on income inequality.
What Does a Gini Index of 50 Mean?
The Gini index measures income inequality on a scale of 0% to 100%. A Gini of 0 represents perfect equality, while 100 represents perfect inequality. A Gini of 50 signifies a point where income distribution is considered unfair. For example, these are Panama, Brazil, and Zimbabwe.
What Country Has the Highest Gini Index?
South Africa has the highest income inequality in 2022, with a Gini index of 63.0. For example, one reason is that urban workers receive significantly higher wages than others.
Is the US Gini Index High or Low?
The Gini coefficient in the United States is 41.1. For such a developed economy, a score of 41.1 is high. Some economists cite factors such as globalization, minimum wage cuts, technological change, and the decline of unions as causes of rising income inequality in the US.
The Bottom Line
The Gini index measures global inequality. Although the data remains theoretical, it gives an idea about the future course of action needed by nations to avoid significant income disparity among their nationals. The limitations must be factored in while formulating future policies.
Lastly, remember that the availability of correct data is the key to drawing correct conclusions. It can thus be safely assumed that the relevance of the Gini index remains, though it needs to be compared with other economic data to make a correct analysis.
Trading with up to 90% profit
+1 <span>Like</span>