
In the 16th century, in England, there was a law that required every homeowner to own a hammer. With this law in place, in case of a fire, every citizen had the necessary tools to help put out the flames. Imagine if every trader had to use a hammer strategy in case of market fluctuations.
Like a real-life hammer, this strategy can help a trader to achieve their goals and navigate difficult situations. So let’s investigate it together.
Earn profit in 1 minute
What is the hammer pattern?
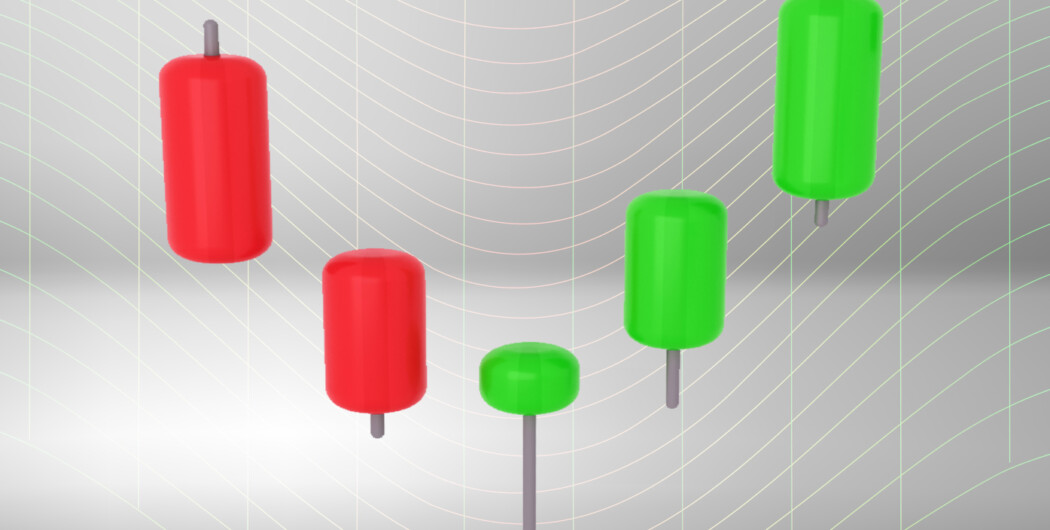
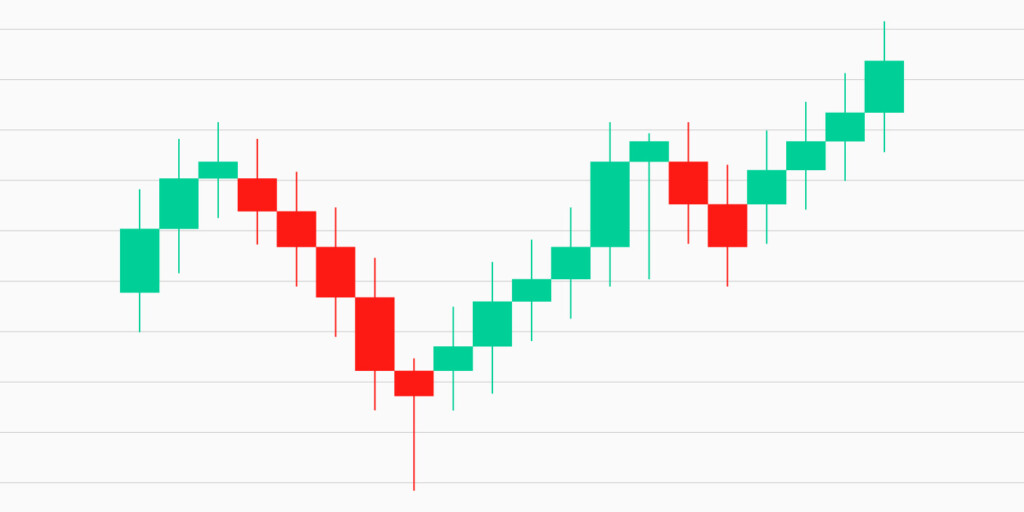
The hammer pattern describes a bullish reversal pattern. It’s called a hammer because the candlestick pattern looks like a hammer, with a small body and a long lower shadow. The shadow represents the price range between the low and the closing or opening price depending on the price direction, and the body represents the price range between the open and the close.
The hammer pattern occurs when an asset opens, trades lower during the day, but then rallies to close not far from its opening price. This indicates that buyers stepped in to support the asset and that the selling pressure may be over. For traders, it’s a signal that the asset may be ready to reverse its trend and start moving higher.
As for the hammer’s history, it’s not associated with any one person who noticed it. It is just one of many candlestick patterns that are used to identify potential trading opportunities based on price action and chart analysis.
Effective strategies in your mailbox
Subscribe and discover a fund of trading knowledge
Great! Please check your email
We’ve sent you an email to confirm your subscription
Something went wrong
Try reloading the page. If that doesn’t help, please try again later
Hammer and inverted hammer candlestick pattern

The inverted hammer candlestick looks similar to the hammer pattern, but it’s upside down—a small body, a long upper shadow, and a short lower shadow. It’s also formed at the bottom of a downtrend.
The top part of the candlestick’s long shadow appears when the bulls push the price up. But the bears (or short-sellers) show some resistance, causing a small body to be formed at the bottom. In the end, the bullish trend proves too strong, and the market settles at a higher price.
There is no such thing as the inverted hammer candlestick pattern at the top, as it’s still a signal of potential bullish reversal.
Hammer and hanging man

To avoid repeating what’s been said, let’s focus on the hanging man. It’s a bearish reversal pattern that is formed at the top of an uptrend. The candle can be both bullish and bearish. It just needs to have a small body, which is at least twice shorter than a lower shadow. The lower shadow shows that bears were strong enough to take control of the market for a period. This pattern suggests that the buying pressure has weakened. The uptrend may be losing momentum, potentially signaling a shift toward a bearish trend. If you’re bullish on an asset, consider it a warning sign.
While the hammer and hanging man have similar shapes, the key difference is in their position relative to the trend.
7 golden rules of trading
Everyone has their own trading style, but some principles are critical for success. Make sure you’re following these basic rules of trading.
Read more

How to read the hammer pattern
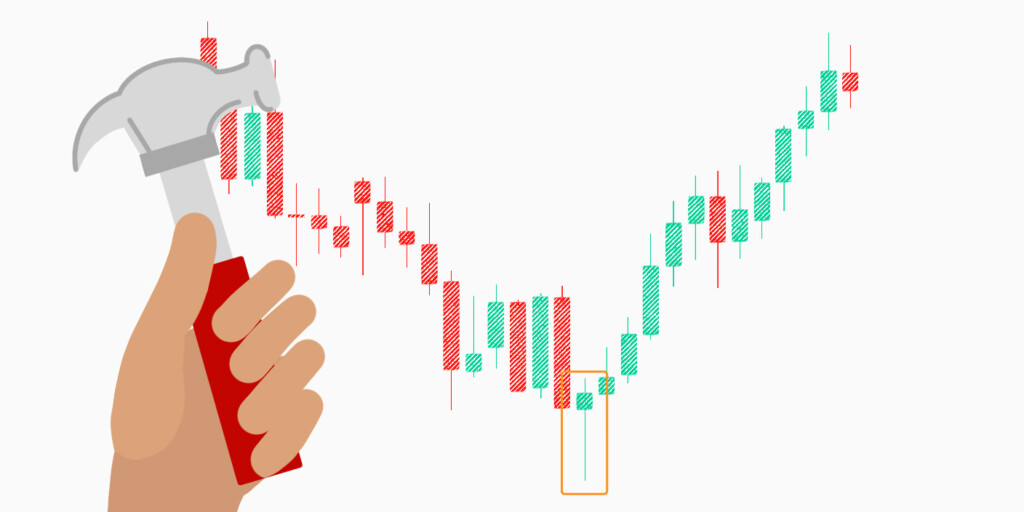
Remember that you can’t see the hammer candlestick pattern in an uptrend, but if you see it formed at the bottom of a downtrend, perhaps you should be preparing for a reversal. But how can you be sure? Well, if you want to be more confident, here are the steps to read the pattern:
Start from $10, earn to $1000
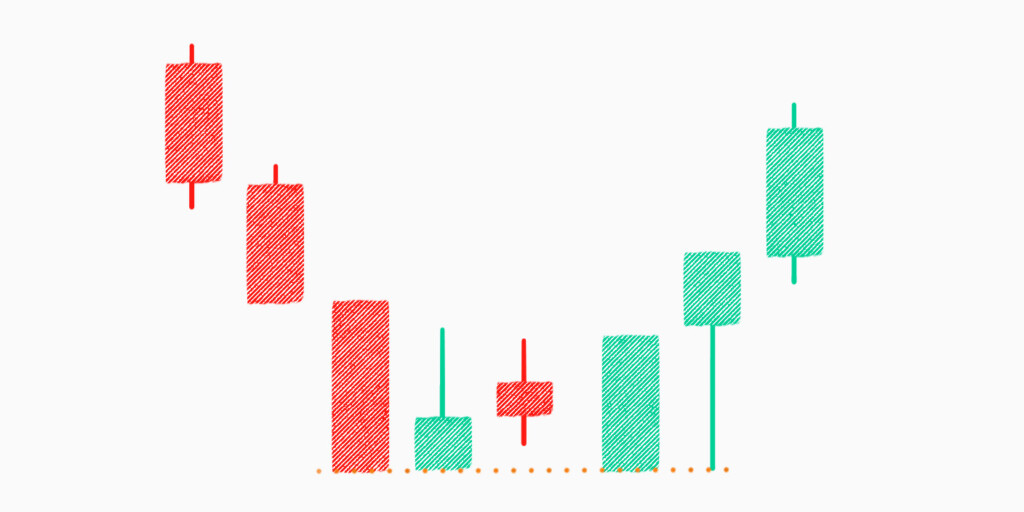
- Look for a small body. The difference between the open and close prices is small, the selling pressure has weakened, buyers are starting to step in.
- Look for a long lower shadow. The difference between the low and the close/open price is large, the asset traded lower during the period, buyers stepped in, pushing it higher.
- Look for confirmation. Before taking the hammer pattern as a definite sign of a bullish reversal, confirm the signal. For example, you might look for other bullish indicators, such as a moving average crossover or an increase in trading volume.
How to trade with the hammer
Now, it’s time to see what the hammer is capable of in practice. There are multiple strategies that use the hammer pattern effectively, but let’s only focus on three:
Top-bottom strategy
When using the hammer pattern in this strategy, the first requirement is to identify a strong downtrend that has broken all near-term lows. This could be evidence that the market is oversold and due for a potential reversal. All in all, this strategy seeks to identify significant turning points in the market.
Let’s say you’re trading a stock, and the price moves lower and breaks below the near-term low. However, it shows the first sign of upcoming bullish pressure with an indecision candle, followed by a bullish hammer.
To trade with the hammer pattern using the top-bottom strategy, place a buy order above the hammer’s high price. You can set the stop loss below the shadow, and make sure to leave some wiggle room to allow for potential market fluctuations.
Support-resistance trading
Support and resistance levels are key concepts in technical analysis, and they represent areas where the price has historically had difficulty moving past or below. The market usually turns around at such levels. Now, here is where this topic intercepts with the hammer.
Let’s say you see that the price has been decreasing and now is approaching a solid support level, this gives you a signal that bullish pressure may be on the horizon.
Although the bears try to push the price lower, they are met with resistance from buyers. The bears fail to take the price lower, and the candle closes with a bullish hammer, another thing pointing to bullish pressure. Sometimes, there is a doji candle before the hammer, this is the first sign of upcoming bullish pressure
If you have noticed a growing bullish demand in the market, consider taking advantage of it by placing a buy order above the hammer’s high price. Arrange some protection for yourself with a stop loss below the shadow and some breathing space.
Intraday trading with moving average
The first step is to identify the overall market trend, which, in this case, should be bullish. There may be bearish corrections when sellers decide to take profits from their investments, causing a temporary dip in prices. But in most cases, buying pressure may resume after this period after the temporary bearish correction.
The strategy suggests using the dynamic 20 EMA as a minor support level to gauge the market sentiment. If the price of the asset bounces off, the reasonable conclusion is that buyers are entering the market, and it could be a potential buying opportunity.
Moreover, if the price is moving along with the EMA, you can assume that the market sentiment is bullish. In this case, any rejection from the EMA could be an opportunity to buy the asset as the price may continue to move higher.
Place a buy position at the high of the hammer candlestick and set a stop loss below the shadow of the candlestick. This will minimize the risk exposure in case the market turns unfavorable.
Conclusion

The hammer’s distinctive shape and position on the price chart are hard to miss—a small real body, a long lower shadow, and little to no upper shadow. Together, the shape and position generate a signal you don’t want to miss. The pattern is most reliable when appearing at the end of a downtrend, indicating a possible reversal.
However, the hammer may also show a retracement of the intraday bearish trend instead of a reversal. Therefore, to succeed with this trading strategy, you need to consider the market context, candlestick location, and market momentum. And make sure to confirm the signal with other indicators for higher accuracy!
Sources:
Hammer candlestick – overview, how to identify, characteristics, Corporate Finance Institute
Hammer candlestick: what it is and how investors use it, Investopedia
How to trade the inverted hammer candlestick pattern, HowToTrade
Trading with up to 90% profit
+3 <span>Like</span>