The Heikin Ashi chart (HA), also sometimes spelled Heiken-Ashi, is a modified way of displaying price data on a candlestick chart. Unlike Japanese candlesticks, this technique averages price data to filter out market noise and eliminate some false signals. Smoothed-out volatility is both a good and bad thing in trading, and this article will show you why.
Heikin Ashi translates to “average pace” (Japanese 平均足, Heikin means “average,” and Ashi means “pace”). The merchant who traded in the Dojima Rice Market in Osaka didn’t use this exact method. However, when a similar price forecasting method makes someone a billionaire (in today’s money), you can’t help but look into it.
Earn profit in 1 minute
What Is the Heikin-Ashi Technique?
The Heikin-Ashi technique is a technical trading tool based on the Japanese candlestick pattern. Created by Munehisa Homma, this technique uses candlestick charts to visualize and represent the price data on the market.
The formula can catch signal trends in the market and forecast what the price movements will be. In other words, it works with available price data, using its average to remove the market noise.
With the market noise gone, you will get a clear illustration of the market directions and trends. This way, you can see precisely where the price will move.

This technique is helpful, as it assists traders in determining what they should do with a trade. Whether they should hold onto it, pause it or look for a reversal, this technique can help them adjust their positions.
Done correctly, the formula can either help you void losses or lock yourself into profit. If your chosen opposition is a good one, then this technique should tell you whether you are on the right path or not.
The technique holds similarities to the traditional candlestick chart. The only difference is that the Heikin-Ashi features a slightly different formula, with two moving averages. As a result, it creates a smooth and easy-to-read chart, where reversals and trends are easily spotted.
Heikin-Ashi charts also remove the gaps while obscuring certain price data. This makes them easier to read.
Effective strategies in your mailbox
Subscribe and discover a fund of trading knowledge
Great! Please check your email
We’ve sent you an email to confirm your subscription
Something went wrong
Try reloading the page. If that doesn’t help, please try again later
Heikin Ashi vs. Renko charts
Certain features make Heikin Ashi and Renko charts smoother and less cluttered than traditional candlestick charts. But if you want to learn how to read Heikin Ashi and Renko charts, you will need to approach them differently.
Heikin Ashi charts take an average of prices for a certain period, while Renko charts only show movements of a certain size. A brick can be any price size, such as $0.10, $0.50, $5, and so on — this is called the box size. This means that there will be a new Heikin-Ashi bar for every period. New Renko bricks are on a time axis but are not related to a fixed timeframe — only to a price movement of a certain amount.

The Renko chart on the left shows less data than the Heikin-Ashi chart on the right, but either one can be suitable for you, depending on your strategy and the level of detail it requires.
How to calculate Heikin Ashi candles
Each candlestick on the Heikin Ashi chart includes not only the price movement for the current period but also price information from the past. To make this calculation, the technique uses the following formula:
Start from $10, earn to $1000
- Open (the midpoint of the previous bar) = (Open + Close of Previous Bar) / 2
- Close (the average price of the current bar) = (Open + Close + High + Low of Current Bar) / 4
- High = Highest of High, Open, or Close of the Current Period
- Low = Lowest of Low, Open, or Close of the Current Period
Other than the different methods for candles, Heikin Ashi charts are built like regular candlestick charts.

The time series between candles is customizable and depends on the timeframe you prefer — daily, hourly, 30-minute, etc.
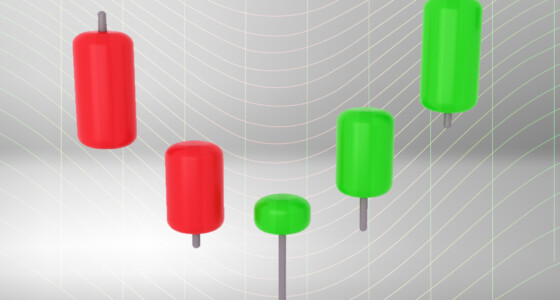
Heikin Ashi bars are either green or red (which correspond to up periods or down periods). Some use empty (white) or filled-in (black) bars instead. The wicks on either side of the bar show the highest and lowest value for the asset.
Cryptocurrencies: what to expect in 2023
2023 is expected to be the year of recovery for the crypto market. Read on to see what to expect in 2023 for cryptocurrencies.
Read more

How to read Heikin Ashi candlesticks

Here is the simplest way of analyzing single Heikin Ashi candlesticks (assuming that standard colors are used):
- Green body: Bullish movement
- Green body without a lower wick: Strongly bullish movement
- Red body: Bearish movement
- Red body without an upper wick: Strongly bearish movement
- Short body with equally long upper and lower wicks: Neutral position (a sign of possible congestion or reversal)
In the same fashion as any other type of chart, Heikin Ashi candlesticks form chart patterns.
- Doji: Looks like a dash, indicates that the price action is stalling and possibly preparing for a counter-trend move
- Wedges (rising and falling): When the price tops and bottoms are moving toward each other, it helps identify breakout entry points
- Head and shoulders: Peak +higher peak + lower peak, a sign of a bullish-to-bearish trend reversal
- Inverse head and shoulders: Valley + lower valley + valley, a sign of a bearish-to-bullish trend reversal
- Rounded bottom: Forms the shape of a U, found at the end of long downward trends
HA candlesticks can also be used to identify the strength of market momentum if you apply trend indicators on the chart. Moving averages, RSI, and ADX are some of the most common ones. However, you can experiment with different indicators.
The Formula for the Heikin-Ashi Technique Is:
The Heikin-Ashi technique uses the following formula:
Heikin-Ashi Close = (Open0+High0+Low0+Close0) / 4
Heikin-Ashi Open= (HA Open−1+HA Close−1)/2
Heikin-Ashi High= (High0, HA Open0, HA Close0) Max
Heikin-Ashi Low= (Low0, HA Open0, HA Close0) Min
where:
Open0 etc. = Values are driven from the current period
Open−1 etc. = Values are driven from the previous period
HA=Heikin-Ashi
Limitations of the Heikin Ashi technique
Constantly alternating green and red bars are common for candlestick charts, which can make the trending direction trickier to identify. Heikin Ashi charts usually have longer stretches of green and red bars, which is simpler to interpret. But this convenience comes at a cost.
The trade setup on Heikin Ashi takes longer to develop (i.e., it has a time lag) because the chart incorporates price information from two periods. Swing traders may not consider it a downside, but if you need to act quickly (for example, as a day trader or scalper), Heikin Ashi will not be as responsive as desired.
As mentioned above, the data is averaged. Instead of actual opening and closing values, you get a smoothed-out version.
Heikin Ashi summed up
Here are the main takeaways from the article:
- The Heikin Ashi chart shares some characteristics with standard candlestick charts.
- It shows the median price movement of an asset.
- Heikin Ashi and Renko charts both smooth out price movements but are based on different formulas and display data differently.
- The HA chart uses a modified formula of open-high-low-close and shows the direction and strength of a trend (especially when combined with trend indicators).
- A simplified analytical process of Heikin Ashi candlesticks can reveal bullish, strongly bullish, bearish, strongly bearish, and neutral price movements.
- The main limitations of the chart are that it displays data more slowly and can obscure important price information.
There is no “perfect” chart that displays exclusively the type of data you need, accurately and without too much noise. So, when you choose your technical analysis tools, you should be willing to make some compromises. Whether Heikin Ashi will be on your list of tools is up to you to decide, but learning new techniques is always a valuable skill.
Trading with up to 90% profit
+2 <span>Like</span>