
It’s a common rule that every signal an indicator, candlestick, or chart pattern provides should be confirmed with another technical tool. Even the most popular and effective indicators may provide fake signals. Therefore, you need to be sure the wrong alerts do not fool you. However, knowing what indicators to combine and how many confirmations you need is vital. Keep reading to discover how to use technical indicators, so they work for you.
Trading with up to 90% profit
A technical indicator is a mathematical calculation of the historical price, volume, or open interest of an asset implemented by traders to forecast a price direction.
1. Don’t use indicators from the same category
All indicators are divided into categories. They are trend, momentum, volatility, and volume. The most common mistake is to apply indicators of the same type. Indicators from one category can replace each other, not confirm each other.
You should learn the difference between duplicate and confirm. For instance, when there is a divergence/convergence between the price and the MACD indicators, many newbies implement another momentum indicator, RSI, and believe the signal becomes stronger. However, RSI and MACD are indicators of the same category and provide similar signals (convergence/divergence). In many cases, they duplicate signals of each other but do not confirm them.
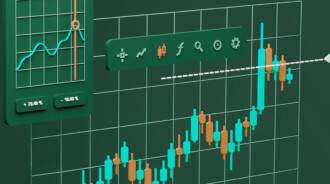
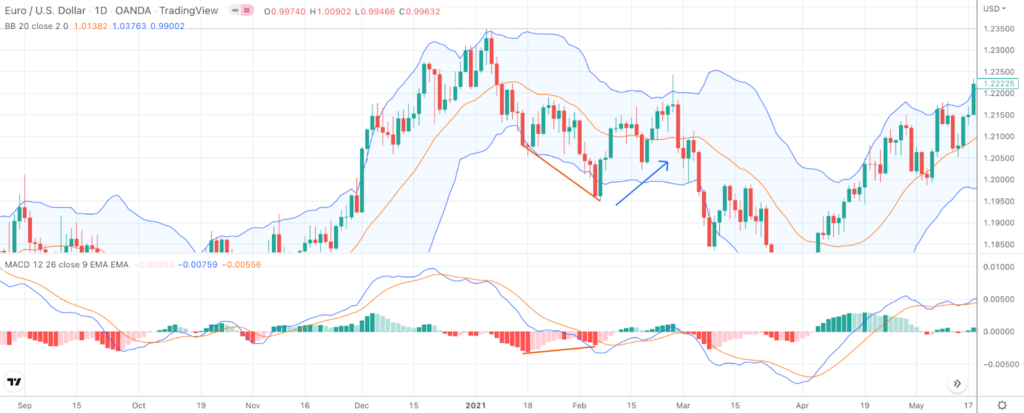
However, if you see a bullish convergence between the MACD indicator and the price chart, you can implement the Bollinger Bands indicator. If the price is near the lower band of it, it’s a confirmation of the following rise. This case is shown in the picture below.
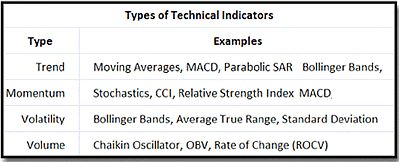
Below, you can see examples of the various indicator types. Some indicators are mentioned in two categories because they can be used for different purposes. If indicators are in two categories, they can be applied together if they don’t provide the same signal (for instance, convergence/divergence).
Effective strategies in your mailbox
Subscribe and discover a fund of trading knowledge
Great! Please check your email
We’ve sent you an email to confirm your subscription
Something went wrong
Try reloading the page. If that doesn’t help, please try again later
2. Don’t confirm signals with too many indicators
More doesn’t mean better in technical analysis. Many newbies believe they must confirm a signal with multiple tools to ensure it is reliable. However, there are at least two reasons why you shouldn’t look for too many confirmations.
You risk losing a good signal while looking for numerous confirmations.
You should always have a set of indicators that cooperate and may confirm signals of each other. Otherwise, you will try numerous tools and miss a trading opportunity. Combine 2-3 indicators. It’s enough to be sure the signal is reliable.
You risk being confused with multiple signals.
Not all indicators correlate and can confirm signals of each other. You may find another alert or no alert at all.
3. Don’t force indicators to confirm signals
Before you determine specific indicators in your strategy, you need to test them on a demo account or historical data. Indicators must provide the same signals most of the time, not once. Even if you found two indicators that gave the same signal once but didn’t correlate in other cases, you shouldn’t try to make them work together.
Start from $10, earn to $1000
To be sure tools work together, you don’t need specific calculations. Just check how they would confirm signals of each other in most potential trades. If they correlate most of the time, use them in your strategy. If they don’t, don’t waste your time changing their parameters just because you want them to work.
Top 5 sitting postures for traders
Many traders think less about their sitting postures, negatively impacting their health. Check it out!
Read more

4. Don’t try to make indicators too perfect
To make indicators work for you, you should determine workable parameters. Every tool is added to the chart with the most common settings that have proved their effectiveness. However, every strategy should consider specifics of the timeframe, the asset, and the amount of funds you use. Your task is to identify the best parameters for your trading approach.

When changing settings, don’t change the whole indicator. Your aim is to make the indicator effective, not to force it to provide signals. Keep in mind that there can be no signal or a fake signal. You should evaluate the winning rate. Calculate how many winning and losing trades you would have with certain parameters. The indicator is set well if the percentage of winning positions is much more than 50%.
Also, if one indicator needs changes and another one doesn’t, don’t try to change another one.
Indicator categories
Traders use a variety of indicators, some of them even self-developed. All of these indicators are added to a certain category, based on their effect. This includes:
· Momentum Indicators: Stochastic, CCI, RSI, Williams %, MACD
· Trend: ADX, Moving Averages, MACD, Parabolic SAR, Bollinger Bands
· Volatility: Bollinger Bands, Standard Deviation, Keltner Channel, Envelopes
· Chart Studies: Horizontal lines, Fibonaccis, Fib extensions, Trendlines
Some indicators such as Ichimoku Cloud and ATR are not in a specific category but have all-in-one features. They are categorized based on their intended use.
Examples
Indicators may be combined based on the data that you want to read. If a chart has three different indicators, all of them are supposed to complement each other. Gathering the same data is non-essential and counter-productive.
For example, you may have a chart with an RSI, an ADX, and a Bollinger Bands indicator. RSI will measure the momentum at play, ADX will look for trends, whereas Bollinger Bands will analyze the volatility.
You may also combine RSI with Bollinger Bands so that you may receive complimentary information. For example, the RSI will offer you information on the momentum. If the RSI is around 50, it means you are lacking momentum. If the RSI is higher and rising, you have a bullish momentum.
Mixed with the Bollinger Bands, you will get information on both trends and volatility. You will be able to note the trending phrases, along with the price break and potential reversals. This will help you make a more informed trading decision.
Summing up
When confirming signals, remember that the set of indicators you use may sometimes fail. There is no perfect set that will lead to winning trades only. It’s enough to find those indicators that work together in most cases. Also, change the combination of indicators according to the strategy you implement.
Earn profit in 1 minute
+1 <span>Like</span>