
Here is a fun story about performance tracking. In the early 2000s, the Oakland Athletics struggled to attract and retain top talent. So they decided to use metrics — on-base percentage — to identify undervalued players and build a dream team on a budget. This proved to be much more effective than traditional scouting methods. And a few years later, this brilliant story became the basis for Michael Lewis’ book Moneyball and the film of the same name.
“It’s not enough to simply track profits and losses; you need to dig deeper and analyze your strategies using metrics and tools that can provide insights into your risk tolerance, position sizing, and overall money management.”
Michael Casey, Senior Advisor at MIT Media Lab
Now that you know about the positive impact of tracking and measuring, you’re probably more motivated to learn how to measure trading performance. If so, here are six essential metrics:
Start from $10, earn to $1000
Absolute Drawdown
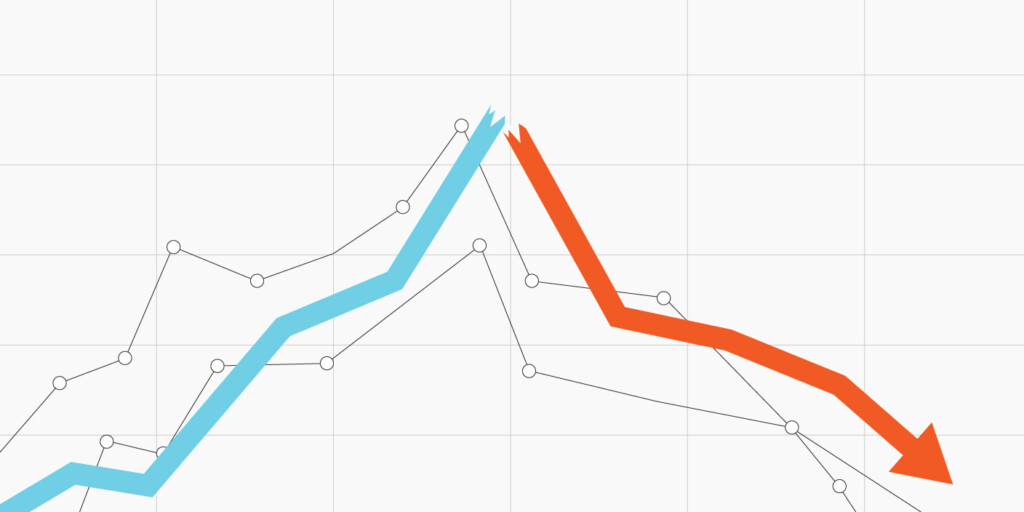
In simple terms, absolute drawdown measures the amount of initial risk involved in a trade. It represents the difference between the initial deposit and the minimal point below the deposit level. For example, if the deposit amount is $10,000, the maximum portfolio value is $16,000, and the minimum is $7,000, the absolute drawdown is $3,000.
What does this mean for you as a trader? It shows you how big the loss is compared to the initial deposit during trading. If the absolute drawdown value is 0, it means no capital is at risk. However, if the value is high, you’re putting a lot of funds at risk.
Effective strategies in your mailbox
Subscribe and discover a fund of trading knowledge
Great! Please check your email
We’ve sent you an email to confirm your subscription
Something went wrong
Try reloading the page. If that doesn’t help, please try again later
Relative Drawdown

Another aspect is knowing how to track trading performance with relative drawdown. This metric shows the percentage difference between the highest point in your trading account and the lowest point after that. It gives you an idea of how much your account value has decreased from its lowest point compared to its highest point.
For example, you’re closing the trade with a balance of $800 and placing a new order. The new order ends up going in the opposite direction with an unrealized loss of $400. In this case, the relative drawdown is 50%.
Profit Factor Measures
The profit factor compares the total amount earned from winning trades to the total amount lost from losing trades. Ideally, you want your profit factor to be above 2.0, but anything above 1.5 is considered good enough. If the measure is less than 1.2, it suggests that you are taking too much risk to make money. And if it’s less than 1.0, you’re losing money with your current strategy.
Trading with up to 90% profit
Let’s say strategy A has a profit of $400 from winning trades and a loss of $300 from losing trades. Its profit factor is 1.33. If you compare it to strategy B, with a profit of $550, a loss of $450, and a profit factor of 1.22, you’ll see that strategy A is slightly more efficient.
5 of the best scalping indicators to use right away
You can experiment with various indicators, but there are some you can use right away to build your best scalping strategy.
Read more

Standard Deviation Measures
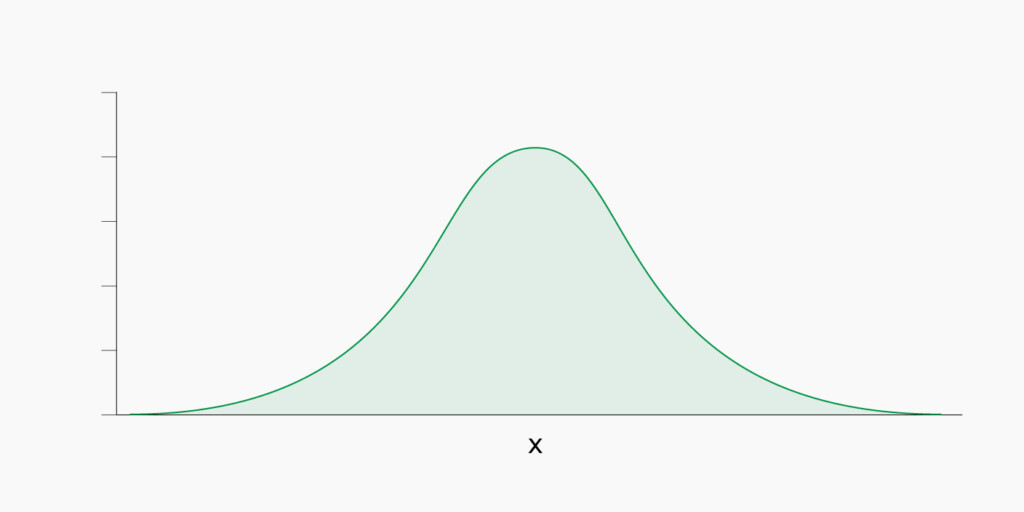
If you want to know how to evaluate a trading strategy, you also need to understand how standard deviation works. In investing, standard deviation is a key metric to gauge market volatility and subsequently, risk. Essentially, it estimates the deviations in the asset price, and these deviations, in turn, indicate its volatility. The wider the range and more unpredictable the price movements, the greater the risk. In other words, high standard deviation = high volatility = increased risk.
Sharpe Ratio Measures
The Sharpe ratio helps you assess the returns generated by a particular strategy relative to the risk taken on. A higher Sharpe ratio communicates that a strategy has generated better returns for the level of risk taken. This is important because, after all, every trader is aiming to maximize returns while minimizing risk.
It doesn’t necessarily tell which strategy is better; rather, it points out potentially excessive risk-taking. For example, if a trader had the same returns from two strategies, but one had a higher Sharpe ratio, the other one isn’t as good at achieving those returns considering the risk.
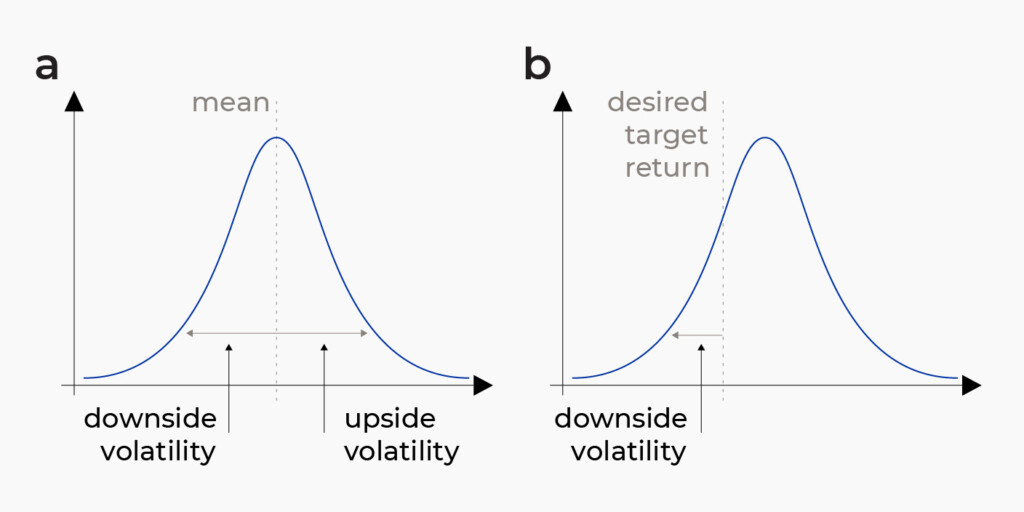
Sortino Ratio

Unlike other metrics that consider all deviations from the average return, the Sortino ratio focuses only on negative returns. So, the metric represents the downside risk, i.e., how much extra return you get for each unit of risk that causes losses.
The Sortino ratio provides a more accurate picture of how a strategy performs during market downturns. For example, if strategy A has a ratio of 0.5, and strategy B — 1.14, Strategy B is a better choice for traders who are more risk-averse. Another thing worth mentioning is that Sortino is better suited for high-volatility assets.
As you can see, learning how to evaluate trading strategies requires a data-driven approach. It’s not about feeling or intuition but using objective metrics to assess performance and identify areas for improvement.
Sources:
Drawdown: what it is, risks and examples, Investopedia
Standard deviation definition, BabyPips
Sharpe ratio – how to calculate risk adjusted return, formula, Corporate Finance Institute
Sortino ratio | formula + calculator, Wall Street Prep
Earn profit in 1 minute
<span>Like</span>