
Divergence is one of the most effective tools to predict a price direction. The only pitfall is your ability to identify it. Divergence occurs between a price chart and an oscillator.
Oscillators are momentum indicators that fluctuate within a certain range. Momentum indicators are tools that determine a price’s strength and weakness.
Let’s examine how divergence works, what indicators help traders identify it, and what strategies you can implement when trading using divergence.
Trading with up to 90% profit
Divergence trading: the basics
Indicators are used to determine the future price direction. They are based on historical data, as a price is supposed to repeat its movements. Most indicators are lagging. Therefore, they follow price fluctuations. It means they are supposed to reflect the price direction. However, this isn’t always the case. Sometimes, indicators don’t follow the price. This is where the divergence occurs.
Divergence is a market condition in which an indicator doesn’t follow price movements. Look at the picture below.
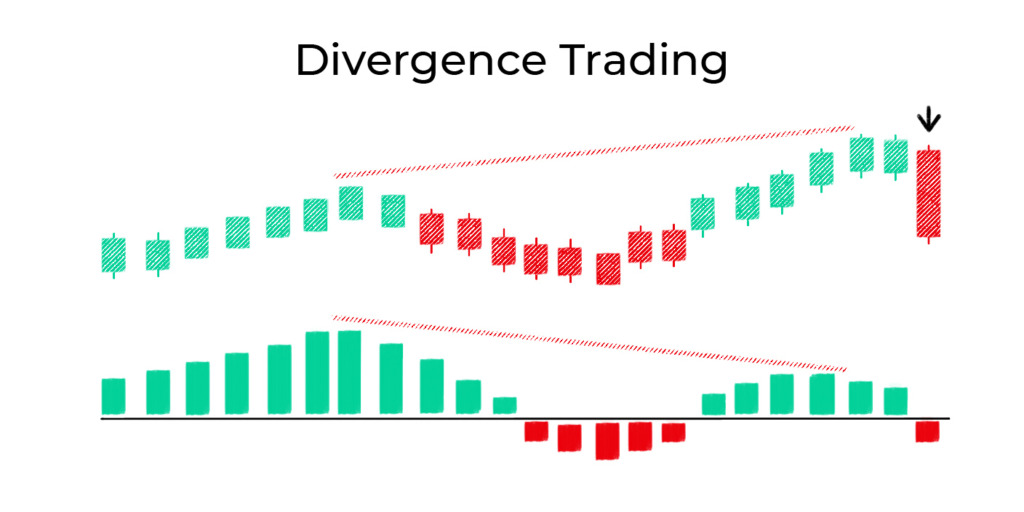
As you can see, the price has a higher high, while the indicator forms a lower high. It’s the divergence. Such a situation can be used to predict future price direction. To know what signals the divergence provides, you need to learn its types.
Effective strategies in your mailbox
Subscribe and discover a fund of trading knowledge
Great! Please check your email
We’ve sent you an email to confirm your subscription
Something went wrong
Try reloading the page. If that doesn’t help, please try again later
Divergence types
There are only four divergence types: (1) regular bullish, (2) regular bearish, (3) hidden bullish, and (4) hidden bearish.
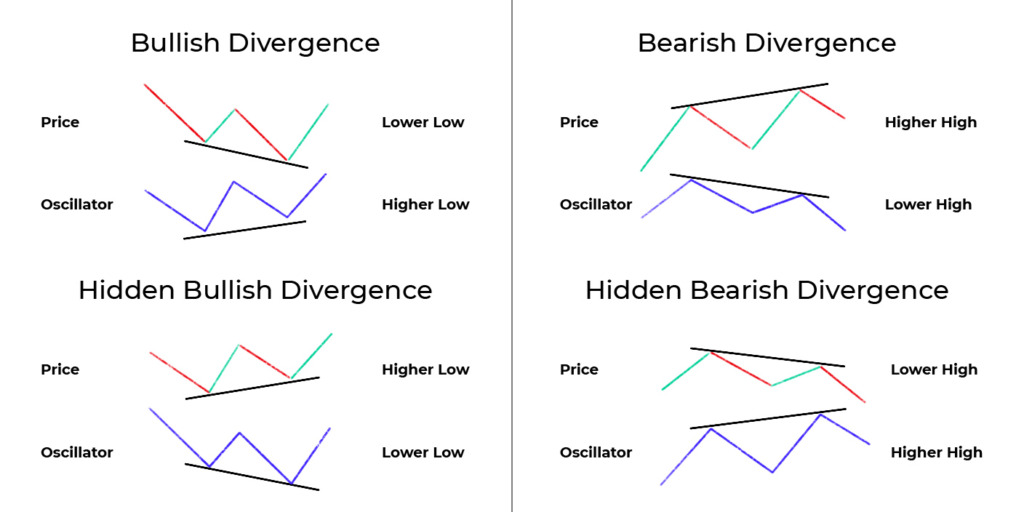

- The regular bullish divergence occurs when the price forms a lower low, but the indicator has a higher low. This means the price may rise soon.
- The regular bearish divergence appears when the price forms a higher high, but the indicator goes down. The price may decline soon.
- Hidden bullish divergence is when the price has higher lows, but the indicator forms lower lows. The price is supposed to rise.
- Hidden bearish divergence is a market condition when the price has lower highs, but the indicator rises. The price is expected to decline.
The hidden divergence provides weaker signals than the regular one.
Everything is clear. Let’s move to indicators that can form the divergence with the price chart.
The best indicator for divergence trading
Some indicators interconnect with the price chart, and some are placed below it. The divergence can only happen between a price chart and an indicator placed below it. Such indicators are called oscillators.
Start from $10, earn to $1000
The most popular oscillators that can provide divergence signals are Relative Strength Index (RSI), Moving Average Convergence Divergence (MACD), and Stochastic Oscillator.
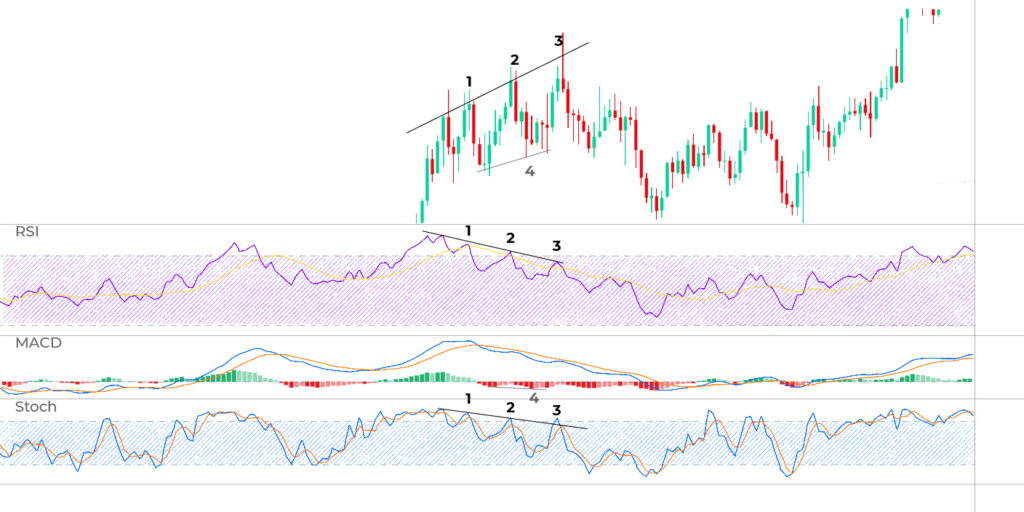
How accurate is divergence trading? Look at the chart above. There are four regular bearish divergences. At the first, second, and third points, the price formed higher highs, while RSI and Stochastic indicators formed lower lows. After the divergences occurred, the price always declined.
You may be confused because there are only three numbers on the chart. But the fourth one is the difference between the first and the fourth peaks. This divergence is the strongest and reflects a trend reversal. The bigger the distance between peaks is, the stronger the signal is supposed to be.
Also, you don’t see the regular bearish divergence between the price chart and the MACD indicator. It’s a typical situation because indicators can’t always provide the same signals. However, if you take a closer look, you will notice a hidden bullish divergence between the lows of the price and the indicator (4). The price turned up after the divergence occurred.
Cryptocurrencies: what to expect in 2023
2023 is expected to be the year of recovery for the crypto market. Read on to see what to expect in 2023 for cryptocurrencies.
Read more

Divergence trading strategy
The most attractive thing for divergence traders is that they can develop their own strategies by testing various indicators and implementing the divergence rules. Have a look at some of them.
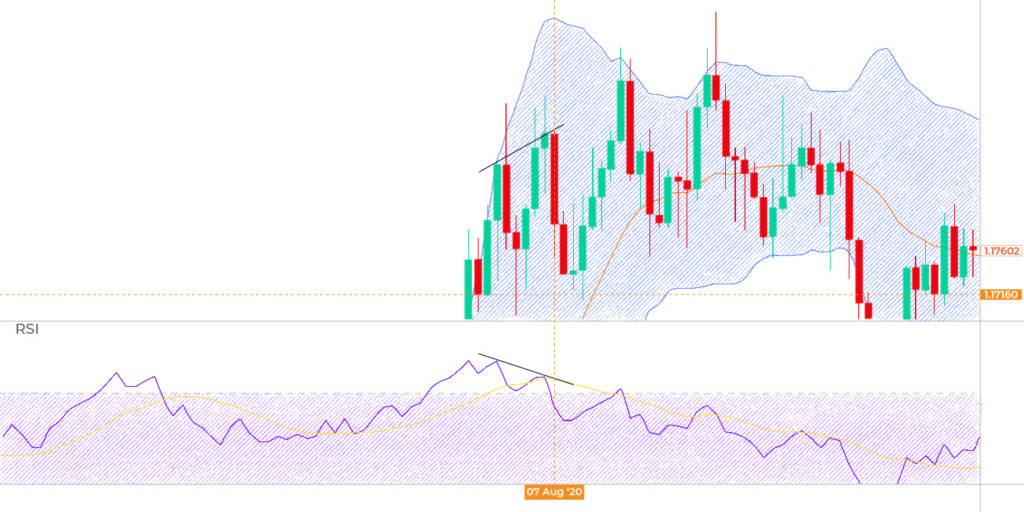
The strategy is based on the RSI indicator and the regular bearish divergence. After you caught the bearish divergence, you could suppose the price would decline soon. The signal became even stronger as the RSI indicator was in the overbought zone. You could open a sell position after the RSI indicator left the overbought area. However, you wouldn’t know how long the decline would last. Therefore, you could place a take-profit order at $1.1716.
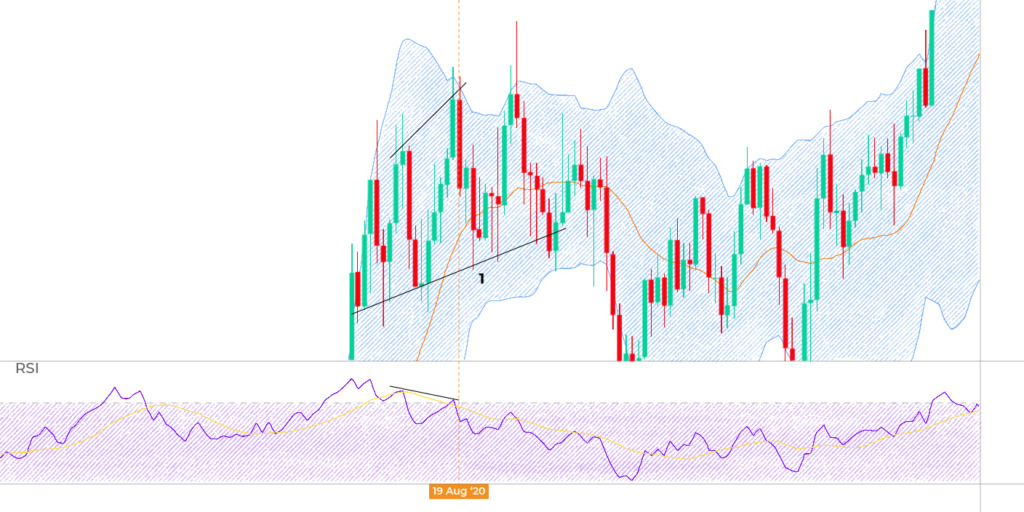

You could also use another regular bearish divergence. The RSI indicator again was in the overbought area. When the price formed a higher high and the RSI indicator went down, the price was near the upper band of the Bollinger Bands indicator. It was the signal the price would decline soon. After the RSI indicator left the overbought area, you could open a sell position and place the take-profit order at the level determined by the trendline (1). In this case, the closest low wouldn’t help you. You should rely on the trendline.
There are no limits on technical indicators and tools you can implement to determine entry and exit points. But every divergence signal must be confirmed with another indicator. Still, you mustn’t use one oscillator to confirm signals of another oscillator. Usually, they provide the same alerts. It means that you don’t confirm but double the same sign.
Summing up
Divergence trading is simple if you know how to read its signals. Use historical price data and demo accounts to combine numerous tools and indicators to have a wide range of strategies you can implement.
Earn profit in 1 minute
+1 <span>Like</span>