The record for riding the biggest wave in surfing history stands at a staggering 26.21 meters (86 feet). This extraordinary feat was accomplished by German surfer Sebastian Steudtner in October 2020 at Nazaré, Portugal. To put it into perspective, it’s comparable to the daunting task of surfing down the face of an eight-story building.
What about volatility waves in financial markets? Well, they’re also very thrilling. These waves can create major opportunities for traders and investors, as well as moments of intense anticipation and rapid price movements. Let’s navigate them with Bollinger Bands, shall we?
Earn profit in 1 minute
Recap on Bollinger Bands

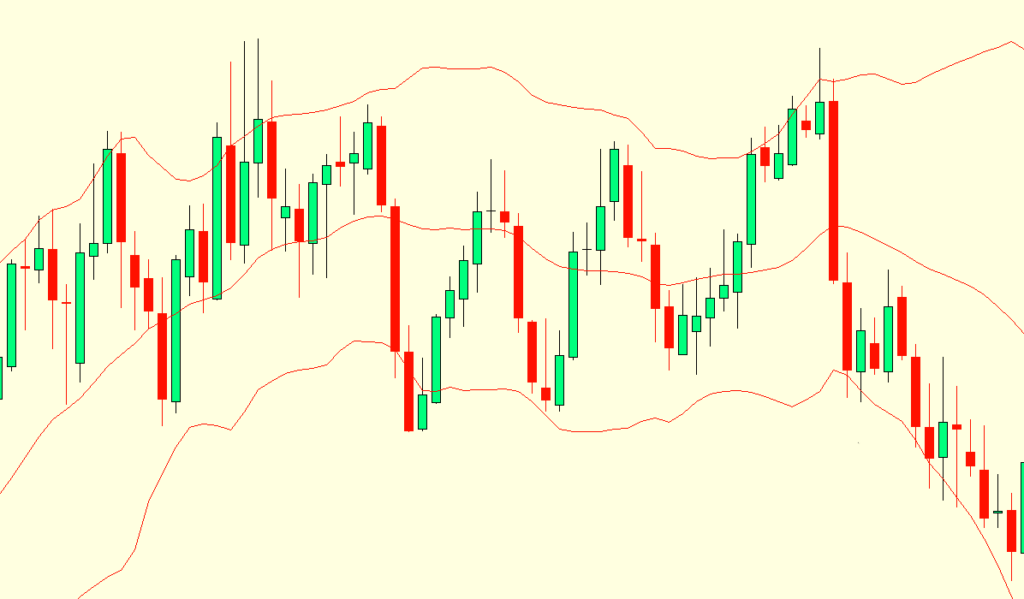
Bollinger Bands are a widely used technical analysis tool created by financial analyst John Bollinger in the 1980s. They consist of three lines: the upper band, the middle band (a moving average), and the lower band. These bands are plotted two standard deviations (both positively and negatively) away from the simple moving average.
Volatility, a key component of BB, is measured using standard deviation. As volatility increases or decreases, the standard deviation changes accordingly. This dynamic nature of the indicator allows traders to gauge the intensity of price fluctuations at different periods.

The middle band serves as a reference point for the price trend, and the upper and lower bands indicate the potential high and low price levels in the immediate future. The distance between the bands is determined by the number of standard deviations chosen by the trader.
Effective strategies in your mailbox
Subscribe and discover a fund of trading knowledge
Great! Please check your email
We’ve sent you an email to confirm your subscription
Something went wrong
Try reloading the page. If that doesn’t help, please try again later
Interpretation of Bollinger Bands
When prices move closer to the upper band of the Bollinger Bands, it suggests that the market may be overbought. This means that the price has experienced a significant upward move, potentially indicating that buying pressure has pushed the market to unsustainable levels. Traders and investors may take this as a signal to exercise caution because a reversal or corrective move could be imminent.
In another situation, when prices move closer to the lower band or the bottom band of the Bollinger Bands, it indicates that the market may be oversold. This suggests that there has been significant selling pressure, and it caused the price to drop to very low levels. Traders and investors see this as a possible opportunity for the price to bounce back or correct itself and start moving upward again.
How to read Bollinger Bands
Here are some key patterns to read using BB:
Start from $10, earn to $1000
Squeezes
Bollinger Band squeezes occur when the bands come close together, indicating low volatility. A squeeze suggests market consolidation or indecision, potentially leading to a breakout or significant price move. Conversely, widening bands indicate decreased volatility and increased price fluctuations.
Breakouts
Around 90% of price movement typically occurs within the Bollinger Bands. Therefore, any breakout above or below the bands is considered significant.
Just bear in mind that breakouts don’t directly indicate the future direction or extent of price movement. A breakout simply implies that the price has moved beyond the bands, suggesting a potential shift in market dynamics and the possibility of a new phase of price action.
W bottoms and M tops
A W bottom pattern consists of two rounding bottoms, which signal a potential bullish reversal after a downtrend. Traders will then anticipate a push towards a support level and look for profit opportunities in a rising market.
In contrast, an M pattern forms with two rounding tops, indicating a bearish reversal after a bullish rally. Here, traders aim to capitalize on the exhaustion of the upward trend.
5 of the best scalping indicators to use right away
You can experiment with various indicators, but there are some you can use right away to build your best scalping strategy.
Read more

How to trade Bollinger Bands
There are two essential aspects of trading with BB:
Bollinger Bands as support and resistance levels

Although not always exact, the upper and lower bands of the Bollinger Bands tend to indicate potential reversal points. When trading near the outer bands, technical analysts gain a certain level of confidence regarding the presence of resistance (upper boundary) or support (lower boundary).
With this strategy, it’s important to consider strong momentum and reversal signal:
- Identify situations where the price is approaching or touching the lower BB. Ideally, you want to see a strong downward momentum leading up to this point.
- Look for a candle that closes outside the lower BB, which suggests that selling pressure may have reached an extreme.
- If the next candle forms a bullish reversal pattern, such as a Hammer, Bullish Engulfing, or any other similar pattern, the buying pressure is likely to push the price higher from the support level.
- Once you have identified the confirmation of a bullish reversal pattern, consider entering a long trade.
The vice-versa approach applies to short setups.
Combining Bollinger Bands with other indicators
Combining BB with other indicators can provide additional confirmation signals, and here are a few examples:
- Bollinger Bands and RSI: This helps traders identify potential overbought or oversold conditions. When the price reaches the upper BB and the RSI is above 70, it suggests a sell signal. And when the price hits the lower BB Band and the RSI is below 30, it’s a potential buy signal.
- Bollinger Bands and Stochastic Oscillator: The Stochastic is useful in identifying reversal points. When the price reaches the upper BB and the Stochastic is above 80, it could be a sell signal. A buy signal is triggered when the price touches the lower BB and the Stochastic is below 20.
- Bollinger Bands and Moving Average: This strategy combines Bollinger Bands with a longer-term moving average to determine the trend direction. Traders can use BB to assess if the trend is overbought or oversold, and the moving average — to confirm the trend direction.
- Bollinger Bands and Fibonacci Retracement: By incorporating Fibonacci retracement levels with BB, traders can identify support and resistance levels with greater precision. BB helps determine the current trend, while Fibonacci retracement pinpoints areas where the price may experience a bounce or reversal.
Limitations
Bollinger Bands are primarily reactive rather than predictive. They provide information about past price action and volatility, making them useful for analyzing historical market behavior. However, they do not forecast future price movements or market trends with certainty.
Also, BB is calculated using a simple moving average, which may not capture complex market dynamics or sudden price movements. Traders who prefer using other types of moving averages, like EMAs, may find the SMA used in Bollinger Bands to be less suitable for their trading style.
Concluding thoughts
With their ability to capture market volatility and provide visual boundaries, Bollinger Bands are a useful tool guiding trading decisions. By analyzing the price movements within the bands, traders can gain insights into potential trend reversals, breakouts, or periods of consolidation.
It’s also crucial to note that the effectiveness of Bollinger Bands can vary across different markets and even within the same asset over time. Traders may need to adjust the parameters, such as the period length or standard deviation, to suit the specific market they’re trading. Stay involved and keep experimenting!
Sources:
John Bollinger answers “What are Bollinger Bands?”, BollingerBands.com
Bollinger Bands explained for beginners, Warrior Trading
Trading with up to 90% profit
<span>Like</span>