

An advantage of patterns is that they can be found on a chart of any asset, including currencies, stocks, and cryptos.
There are numerous candlestick patterns you should learn to forecast a price direction. In fact, there are 42 simple and complex patterns, but it isn’t necessary to learn every single one.
An evening star pattern is one of the most frequently-used and reliable patterns you can determine on a price chart. Read on to discover what it looks like and how it can help you in trading.
Trading with up to 90% profit
What is an evening star trading pattern?
An evening star is a candlestick pattern that predicts a downtrend. It consists of three candles. The first one is big and bullish, the second is a candle with a small body, and the third is big and bearish. The second candle can be either bullish or bearish. However, if it’s bearish, the signal is stronger.
As the pattern predicts a downtrend, it appears at the top of an uptrend.
The pattern works well on any timeframe of any asset. But traders usually look for the evening star pattern on Forex.
Effective strategies in your mailbox
Subscribe and discover a fund of trading knowledge
Great! Please check your email
We’ve sent you an email to confirm your subscription
Something went wrong
Try reloading the page. If that doesn’t help, please try again later
What is an evening star Doji?
The evening star Doji is a type of evening star pattern. Doji candles reflect market uncertainty. Their open and close prices are almost equal. If you see a Doji candle after a big bullish candle, it’s a signal the market is unsure whether the upward movement should continue.
If the big bearish candlestick follows the Doji, bears gain strength. This pattern should be traded the same as the evening star.
How to trade an evening star pattern?
How to trade the evening star? The only challenge you may face is finding the pattern on a price chart. Remember that it occurs only at the end of a bullish trend. The second candlestick should be small.
Earn profit in 1 minute
After you find the pattern on the price chart, look for 1-2 bearish candles to occur after the third pattern’s candlestick. It will be a confirmation of the downtrend. After you are sure the pattern worked, you can open a sell position.
The length of the trade will depend on the timeframe. If you trade on short-term periods, you should expect the new trend to be short. If you choose higher timeframes, you can expect the trend to last from several weeks to several months.
The take-profit level can be placed based on the nearest support level. The best way is to use a trailing take-profit order that will allow you to move the target depending on market conditions.
Although the pattern is strong, it may fail. Therefore, it’s vital to set a stop-loss level. Its size will depend on the timeframe and the pattern’s strength, which can be determined with additional indicators.
The chart below reflects the evening star pattern that formed on the daily chart of the EUR/USD pair. The MACD indicator was used to confirm the price reversal. There was a regular bearish divergence when the price formed a higher high, but the indicator didn’t follow.
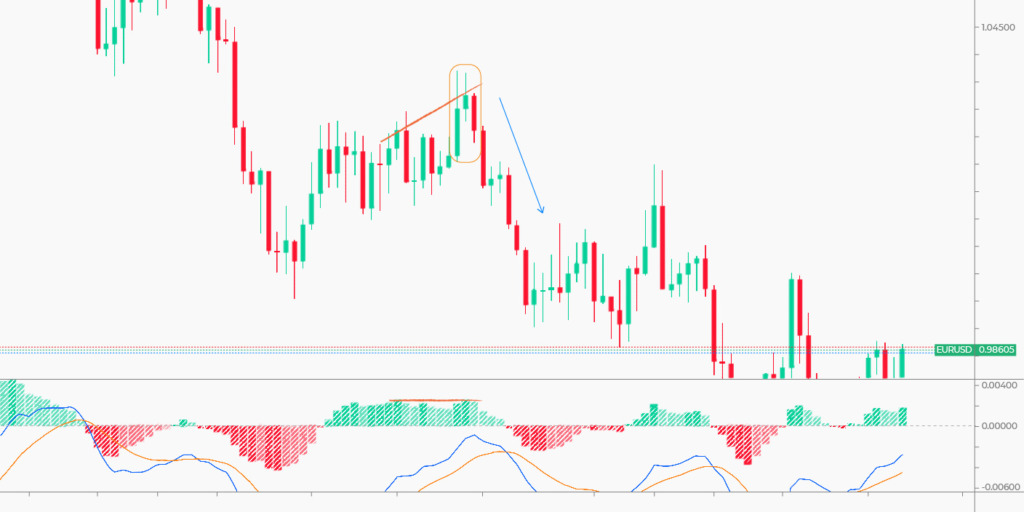
Note: every signal must be confirmed by another indicator or pattern signal. As the evening star predicts a trend change, you can verify its signals with oscillators that reflect overbought/oversold conditions.
Also, you can apply indicators that reflect the trend strength — for instance, the average directional index. Remember that volume indicators show whether bears are strong enough to end the uptrend.
7 golden rules of trading
Everyone has their own trading style, but some principles are critical for success. Make sure you’re following these basic rules of trading.
Read more

How does an Evening Star pattern work?
Evening star patterns appear at the end of an uptrend, suggesting that a downtrend is likely going to take place. It is a highly reliable bearish reversal candlestick pattern with a success rate of 70.2%. When it is used correctly, a trader may use it to close trades and minimize potential losses.
Evening star patterns work oppositely to morning star patterns, the latter suggesting a bullish reversal. They show a big bullish candlestick, a smaller candle, and then a bearish candlestick that can suggest the end of a trend.
Example of an Evening Star pattern

Evening star patterns form over three-day periods. On the first day, you will see a big white candle that suggests a continuous rise in prices. On the second day, you will notice a much smaller candle, which will suggest a modest increase in the price.
On the third day, the candle will no longer be white, but red. It will open below the price of the previous day, closing when it nears the middle of the first day.
Benefits of using the Evening Star candlestick pattern strategy
The evening star offers several benefits that traders can enjoy. Here are the main ones:
· They are easy to find: These patterns are three-candle simple formations that are easy for traders to see, no matter if they are beginners or advanced traders.
· Can receive a confirmation with other indicators: If you use other technical indicators such as resistance and support levels, along with trend lines, you can easily confirm bearish patterns.
· High reliability: Evening star patterns are considered to be some of the most reliable signals for bearish reversals. This makes them very useful if you are trying to profit from a potential downturn.
· Clear stop-loss: If you want to set up a stop-loss order, evening star patterns can help you create a risk management technique.
· Flexibility: The evening star pattern can be used in multiple market conditions. You may mix it with other technical analysis tools so that you may create a comprehensive trading plan.
If you are a trader looking to profit from a downtrend, then an evening star pattern may be very useful.
Pros and cons of the Evening Star candlestick strategy
Similar to every trading strategy, evening star candlestick patterns have their pros and cons. Here are just a few of them:
Pros
· You may use them in various market conditions and combine them with other technical analysis tools, creating a more robust trading strategy
· It is only a three-candle formation, making it easy for beginners and price action traders to catch onto it.
· They are highly reliable for bearish reversal signals, making them great for those who want to profit from a downtrend
· They can be used with various other indicators to confirm a bearish reversal
Cons
· If the market is highly volatile, with frequent sudden price swings, the pattern may not be very reliable
· They have the potential of producing false signals, especially when they are not used with other technical indicators
· While they can suggest a price reversal, this is not always guaranteed
An evening candlestick strategy can be very useful in showing bearish reversal, but since it is sometimes inaccurate, it should be used with other technical indicators as well.
How to trade a morning star pattern?
A morning star pattern is opposite to the evening star. It appears at the end of a downtrend and signals a price rise. The pattern consists of three candles. The first one is big and bearish; the second is small, and its color doesn’t matter; the third is big and bullish. You can find the morning star and evening star patterns on stock charts.
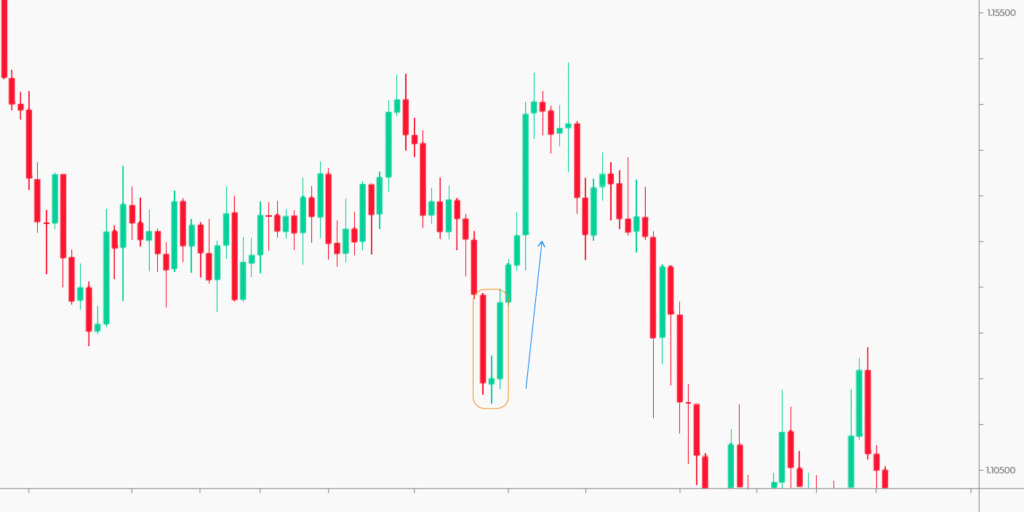
You should apply the same rules when trading this pattern: look for the downtrend and wait for three candles to appear. Be sure the signal is correct, adding indicators that predict a trend reversal.
The price target can be applied according to the closest resistance level, or you can use a trailing take-profit order. Remember about the stop-loss level.
Final thoughts
The evening and morning star patterns are simple and reliable tools that will help you identify a trend reversal. You will succeed if you know how they look. Remember that every signal must be confirmed by 1-2 additional tools. Don’t forget to backtest these patterns on the assets you trade.
Start from $10, earn to $1000
<span>Like</span>