
The candlestick pattern is used to forecast the future trend of market movements. It was created by Japanese rice dealers centuries ago and became well-known among Western merchants in the 1990s by a trader named Steve Nison.
The morning star pattern is one of the many popular candlestick patterns used in trading. In this article, we will discuss how to trade the morning star pattern.
Earn profit in 1 minute
What is a morning star?
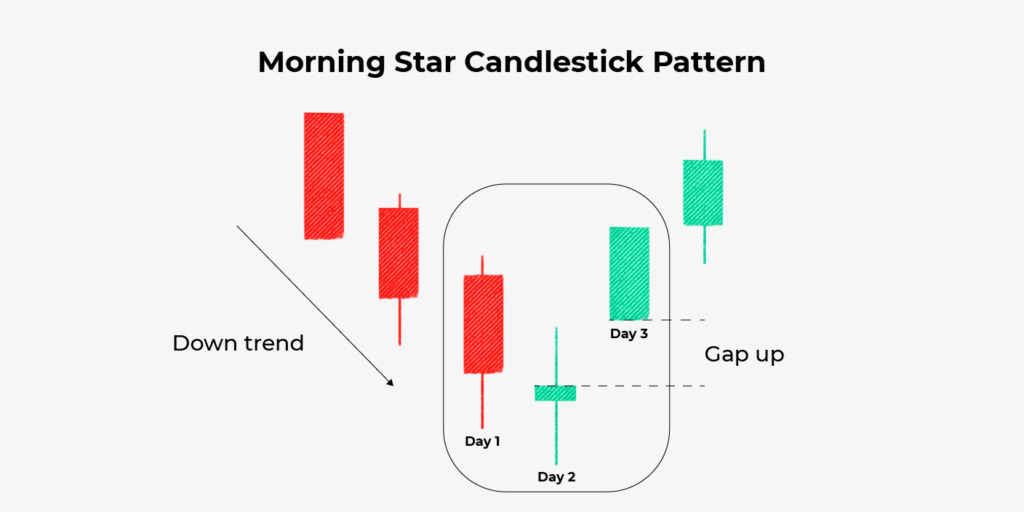
A morning star is a three-candlestick visual pattern that technical analysts interpret as a bullish trend. A morning star develops in a downward direction and marks the beginning of an ascent. It indicates a change in the earlier price trend. Traders keep an eye out for the development of a morning star before employing further indications to establish that reverse is indeed happening.
These three candlesticks make up the bullish reversal formation:
- A long black candlestick extending the ongoing downtrend
- A short mid-candlestick that fell short of the open
- A white candlestick with a long body gapped up on the closed and open above the first candle’s body’s midpoint.
A bullish (empty) or bearish (filled) candlestick can form the star.
Effective strategies in your mailbox
Subscribe and discover a fund of trading knowledge
Great! Please check your email
We’ve sent you an email to confirm your subscription
Something went wrong
Try reloading the page. If that doesn’t help, please try again later
What does the morning star indicate?
There are no specific calculations to make because a morning star is simply a visual pattern. The low point of a morning star is the second candle in a three-candle design. But it is only when the third candle has closed that the low point becomes visible.

You can determine whether a morning star forms if the price movement approaches a support area or if the RSI (relative strength indicator) indicates that the stock or commodity is oversold. These and other technical indicators can predict the formation of a morning star.
A morning star looks like this:
It’s vital to note that the morning star’s centre candle might be either white or black (or green or red) as the session’s sellers and buyers begin to balance each other out.
What does a Morning Star tell you?
Morning stars represent a visual pattern, which means you will not have to perform any calculations. It’s a three-candle pattern that shows a low point on the second candle. The only catch is that the low point only becomes apparent after the third candle closes.
Trading with up to 90% profit
Several indicators will tell you whether a morning star is beginning to form or not. This can include the price action and whether it is nearing the support zone or not. It can also be based on whether the RSI is suggesting a commodity/stock is oversold or not.
Trader’s level test
Answer 7 short questions and define your level as a trader. Take the test now to evaluate your real knowledge!
Start test

An example of how to trade a Morning Star
Morning stars can be used as a sign of the beginning of a reversal trend, going from bearish to bullish. They also become relevant when other technical indicators start backing them up. Volume may also contribute to the formation of this type of pattern.
More often than not, traders want to see an increase in volume throughout the sessions that form this pattern. The third day is supposed to have the most volume. If you see a high volume on that day, then it means you have confirmation of that pattern and a possible uptrend.
Once the morning star forms in the third session, the trader will begin taking up a bullish position on the trade they are working on. They will proceed to ride on that uptrend until they begin to notice evidence that a downtrend is about to happen.
Using only the morning star pattern to trade can be very risky, as visual patterns do not offer all the information. It works best when you back it up with indicators such as support level or volume. Otherwise, you will likely see morning stars each time a small candle appears in a downtrend.
The difference between a Morning Star and a Doji Morning Star
Morning stars come in different variations. As a trader, you need to accustom yourself to them so that you can take a trading decision. A popular variation is the Doji morning star, which can suggest some indecision in the market. Morning stars show this indecision as well, but the Doji morning star is more obvious.
When you see a Doji after a black candle, you will likely notice a more aggressive volume spike. You may also see a long white candle, as a result of traders being able to find the morning star faster.
An illustration of trading a morning star pattern
Morning star formations can be utilized as a visual indicator for the beginning of a reversal from a bear market to a bull market. Still, as previously noted, they become more relevant when other technical analyses support them. The volume that contributes to the pattern development is another essential factor.
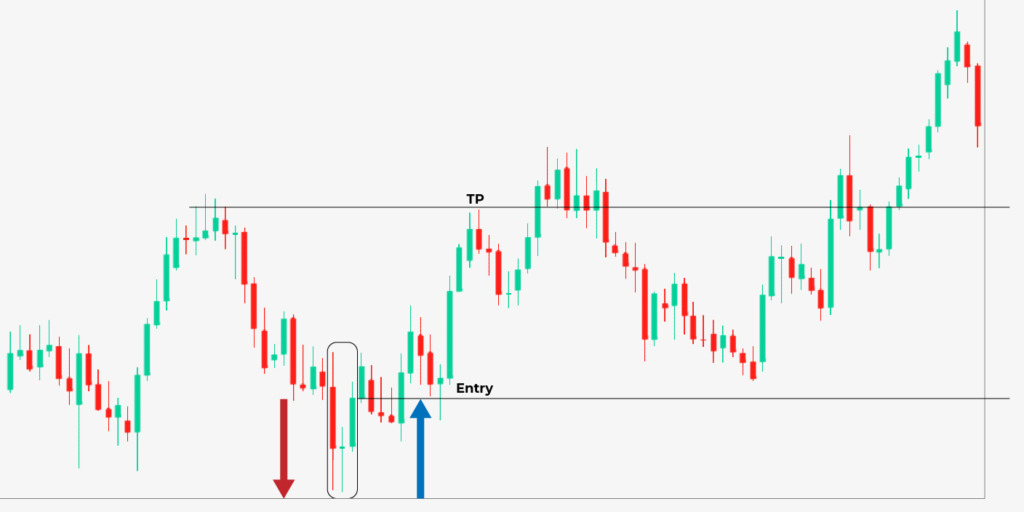
A trader generally seeks to witness rising volume throughout the pattern’s three sessions, with the third day showing the highest volume. Regardless of other signs, high volume on the third day is frequently regarded as a validation of the pattern (and a future uptrend). As the morning star appears in the third session, a trader will open a bullish trade in the stock, commodity, pair, etc., and ride the uptrend till there are signs of another reversal.
Once a bull run has been verified to be in progress, opening a buy position is the standard trading strategy for morning stars. The pattern may not succeed if you don’t verify the movement before trading.
Failure of a morning star would result in the formation of no upswing and a loss on your transaction.
There are primarily two methods for verifying a morning star. The first step is to observe what occurs in the session following the pattern. It might be appropriate to trade if it appears that the bullish trend will continue.
But you can also keep an eye out to see whether volume increases near the close of the pattern. This indicates that the market is becoming more and more competitive, which should drive the price.
Limits and stops
Like any pattern, you should put your stop loss at a time when it is evident that the morning star pattern has failed. This would typically be below the pattern’s “swing” level; if the price falls back under this point, your trade is unlikely to be profitable.
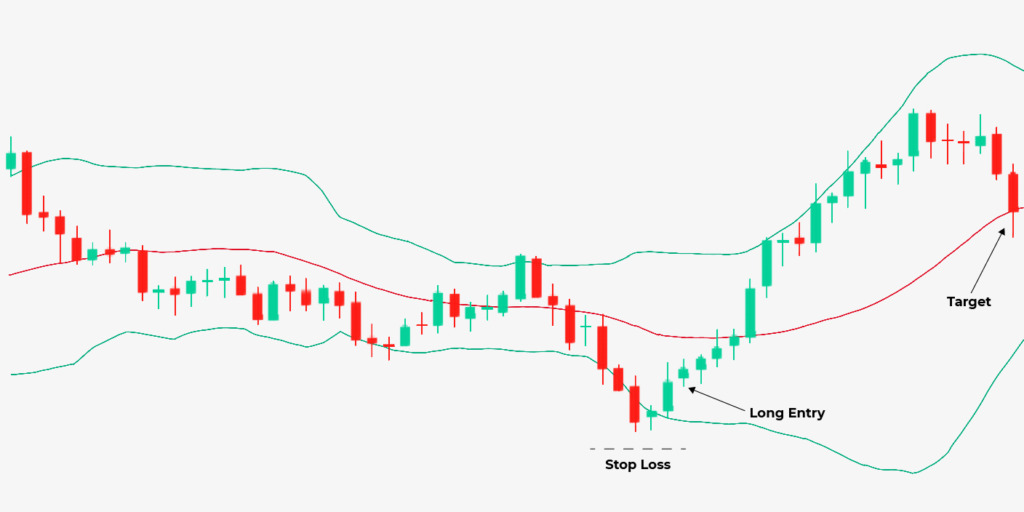

A previous position of consolidation or resistance is typically a good place to aim for when setting profit objectives. Always take into account your risk/reward ratio in this situation. It could be best to pass on this chance and wait for another opportunity if the profit objective and stop don’t match your trading plan.
Conclusion
Trading only based on visual patterns might be dangerous. The best morning stars are supported by volume and another sign, such as a support line. Otherwise, anytime a little candle appears in a downtrend, it is pretty simple to notice morning stars forming.
Start from $10, earn to $1000
<span>Like</span>