
The Wolfe wave pattern refers to harmonic wave configuration seen in all markets and depicts a struggle for equilibrium between the forces of demand for a commodity and its supply, and predicts the reversal of trends. The Wolfe Waves are five (5) waves that indicate either bullish or bearish trends and help a trader forecast where price is headed and the expected time it will attain such price.
The Wolfe Wave was elucidated by Bill Wolfe, an S&P 500 index trader, and helps identify channels that provide a trader with a reliable metric for defining their points of entry and exit in a trade setup.
This pattern can be found on any timeframe but are quite specific in terms of scope. That is, depending on the channel, the waves are visible on the minute, hourly, daily, or monthly timeframes but they can predict scope with remarkable accuracy. Therefore, if judiciously applied, they are quite useful.
Earn profit in 1 minute
How to identify the Wolfe Wave pattern?
To correctly identify as a Wolfe Wave, a series of criteria must be met. However, the underlying principle of the pattern lies in the symmetry. Below are a set of rules guiding the identification of Wolfe Waves:
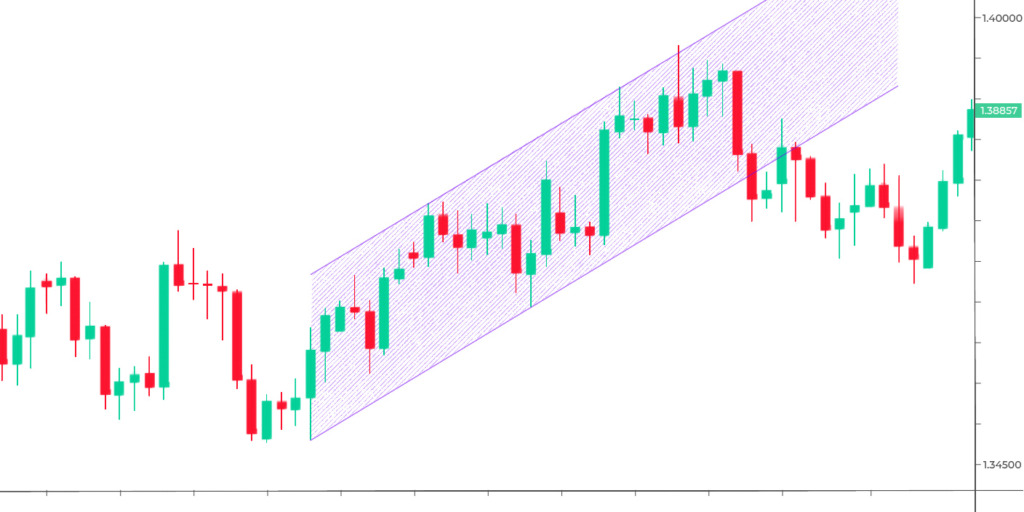
- The Wolfe Waves must form in an equidistant channel. An equidistant channel refers to parallel trend (bullish or bearish) lines that delineate the boundaries of an ongoing trend. It is formed by pinpointing the support and resistance levels in a trending or consolidating chart. The more parallel the trend lines, the better the accuracy.
- Waves 1 & 2 must form a price channel that will contain waves 3 & 4.
- The time between waves 1 & 2 and waves 3 & 4 should be approximately equal
- Wave 5 (the final wave) should break the channel representing a false or pseudo breakout that later ends within the channel.
- Fibonacci extension levels 127% and 162% of the preceding channel point usually coincides with waves 3 and 5 respectively.
Effective strategies in your mailbox
Subscribe and discover a fund of trading knowledge
Great! Please check your email
We’ve sent you an email to confirm your subscription
Something went wrong
Try reloading the page. If that doesn’t help, please try again later
Where can the Wolfe wave be found?
The Wolfe Wave can be seen in the following:
—Uptrends in rising channels
—Downtrends in falling channels
—Consolidations in level or horizontal channels
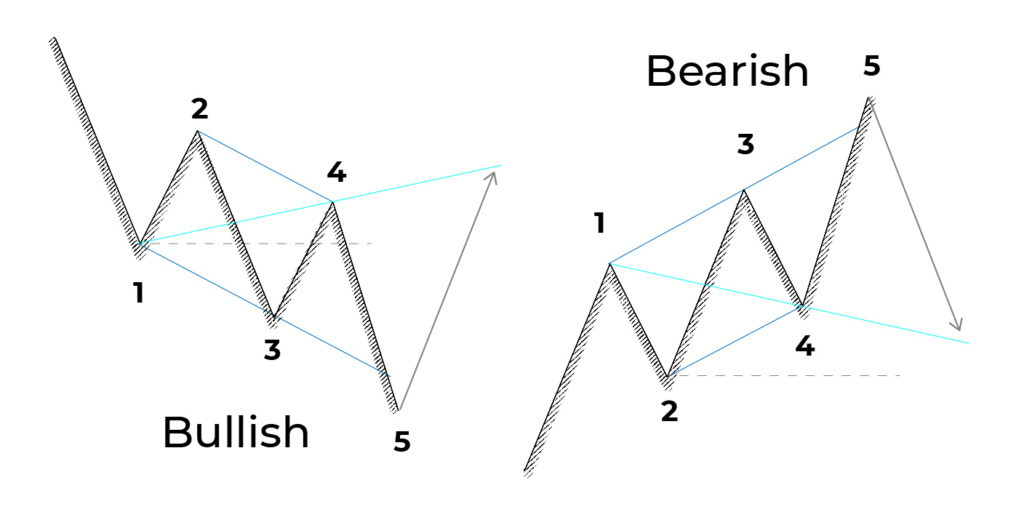
Bullish Wolfe wave

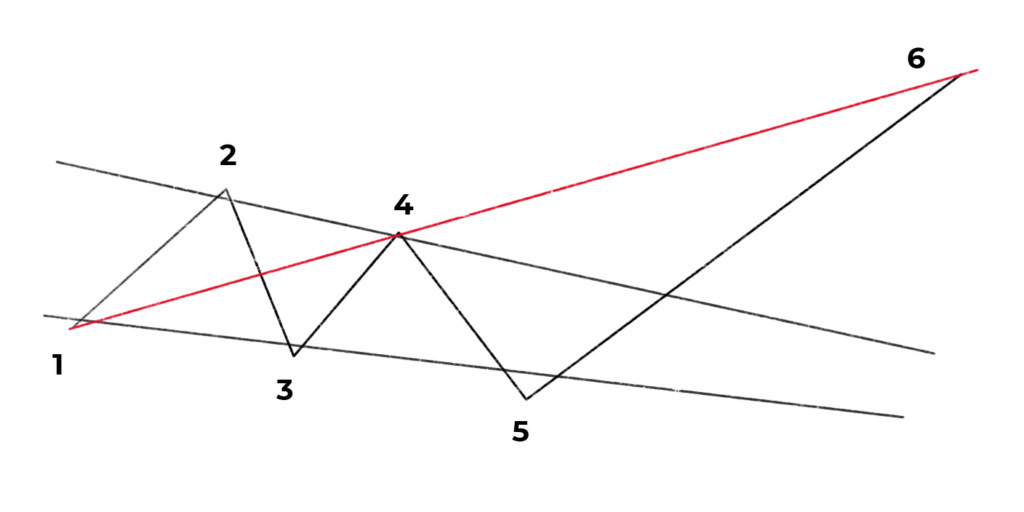
The bullish pattern is seen in a descending channel forming 4 waves of the Wolfe pattern. Here, price will progressively make lower lows and lower highs that depict a downward trend. Following the channel breakout, the 5th wave will form.
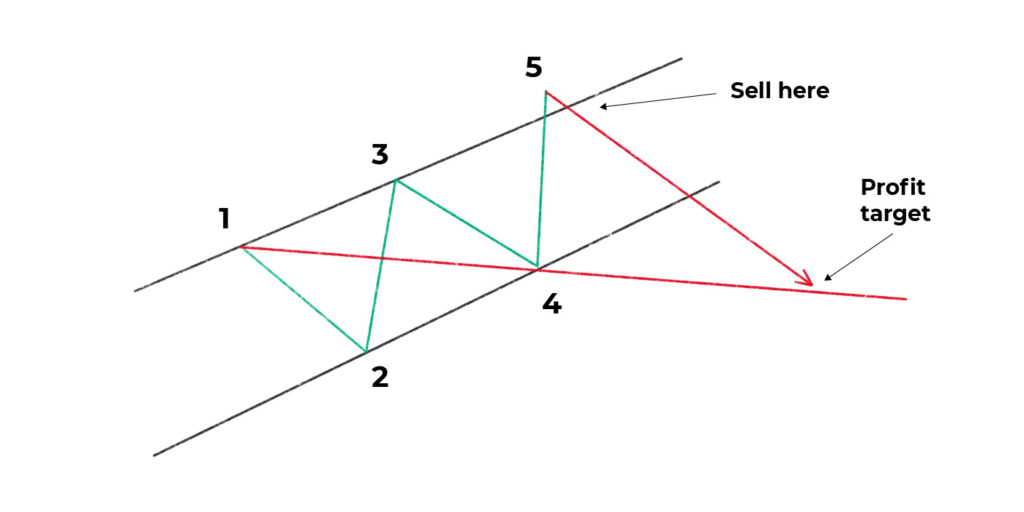
Bearish Wolfe wave
The bearish Wolfe Wave pattern forms in a rising channel forming 4 waves of the pattern. Price progressively makes higher highs and higher lows that depict an uptrend. Following the breakout, the 5th wave will form starting a bearish trend.
Note: whenever the Wolfe Waves pattern is seen in a consolidating market, price can break out in either direction.
What does it tell a trader?
The Wolfe Wave pattern can make traders profitable by helping them identify when a trend reversal is about to happen after 3 attempts and a false breakout.
Trading with up to 90% profit
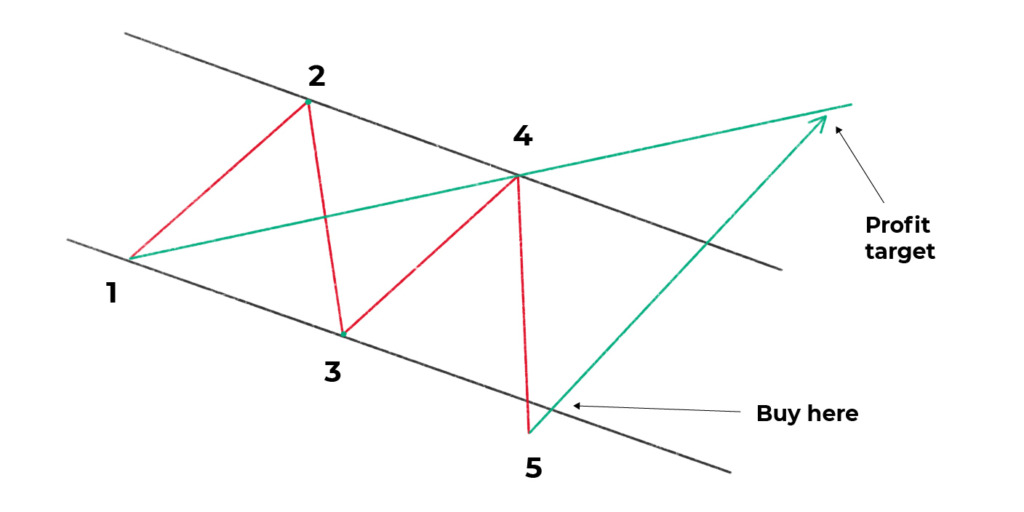
Measuring the take profit level of the Wolfe wave
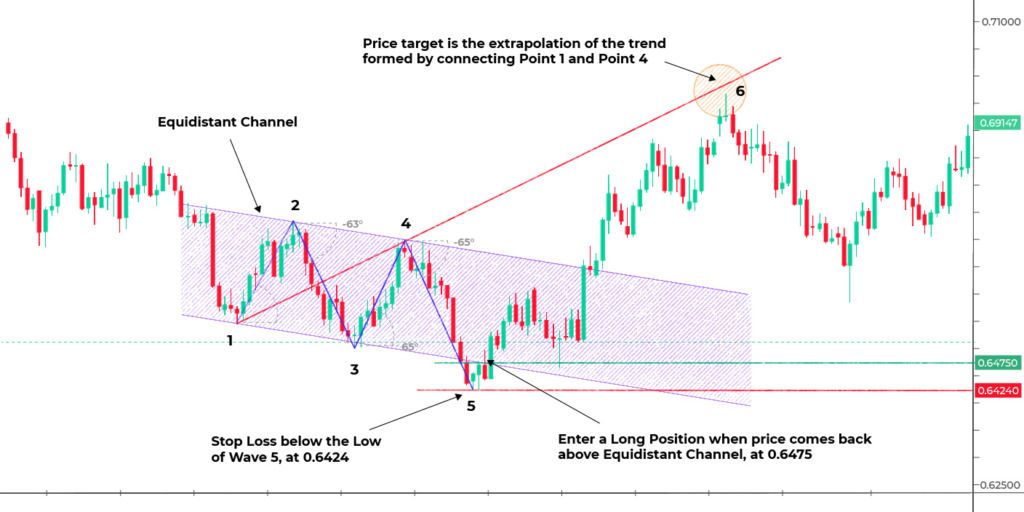
To do this, connect the starting on wave 1 to the starting point of wave 4 and project this line until it meets with the price at a point (wave 6). This is applicable to both bullish and bearish patterns. It is vital to note that there is no precise point for exiting a trade in the Wolfe pattern.
How to start trading with $200 and minimum risk
Don’t let a small budget deter you from trading! Learn how to start trading with $100 or $200 and make the most out of this money!
Read more

Trading the Wolfe Wave pattern: strategy
Both Wolfe waves can be traded in the same way. Below is an example of a trading strategy using the Wolfe Wave setup:
- The first step to taking a trade using this pattern is to recognize the trend in a higher time frame of a trending market. This can be done by locating and marking out the higher highs and lower lows.
- Identify the Wolfe Wave pattern on the chart (Bullish or Bearish) by applying the rules stated above.
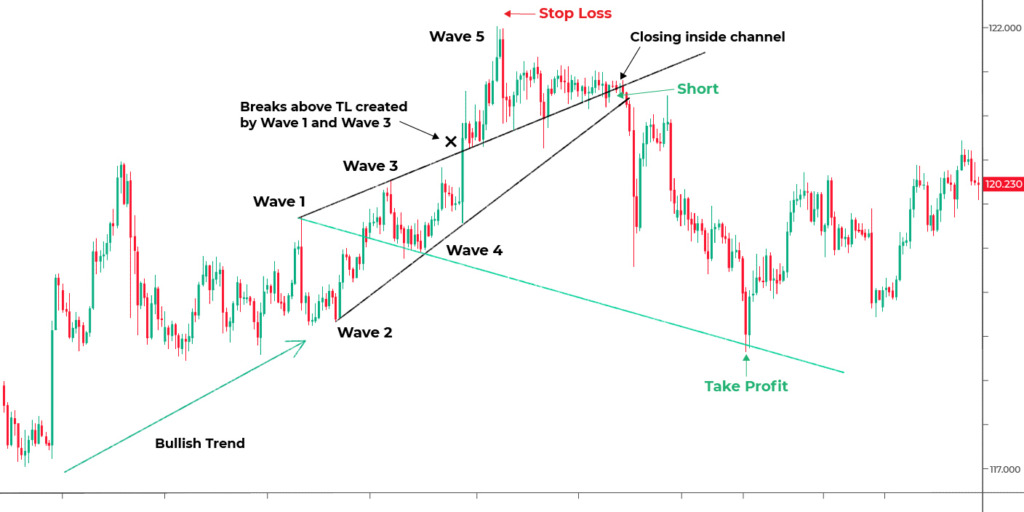
- When price breaks, patiently wait for the price to retrace and close within the channel (wave 5). Open a buy or sell trade when this happens.
- Measure the target level as stated above and place your buy or sell stops below or above the last low or high made by price respectively (that is, above or below wave 5)
If properly learned, it is a very easy to use strategy in trading a trending market.
Example of trading with Wolfe Wave patterns
When trading with Wolfe Wave patterns, you must put together a strategy. Trading can change based on when you buy or sell, which is further decided by whether the pattern is bullish or bearish.
For example, when the channel is descending, it will form a bullish pattern, featuring 4 waves of your Wolfe Wave pattern. The price will create consecutive lower highs and lower lows, after which you should be able to see a downtrend. After the breakout, you will notice the 5th wave breaking out into a bullish Wolfe Wave.
On the other hand, if you have an ascending channel, then you will see the formation of a bearish pattern. You will see higher lows and higher highs, which indicate an uptrend. A bearish trend will start at the breakout when the 5th wave forms.

Before you start looking for bullish Wolfe Wave pattern formations, search for bearish trends. It will become clear before the Wolf Wave even begins to form. This trend will show as a red arrow that moves downward. The bullish trend will follow immediately after that.
You need to look for two symmetrical waves. For instance, waves 3-4 should be in the same channel created by waves 1-2. The final wave, wave 5, should be the one breaking from the channel, signaling that a Wolfe Wave has just formed.
This will suggest that the price will continue going in the breakout direction. If you are using a trend-following strategy, this can turn out to be a great entry point. It can also be used together with Gartleys, to determine a potential downtrend of the market. Gartley patterns are usually used to enter through point D, which is considered a profitable point for traders.
You may also enter a long position the moment a price enters and closes within a price channel. This will help you avoid a potential false breakout. You also need to locate a close back inside the price channel – otherwise, there will be no valid trade signal.
Wolfe Waves and Price Channels
A great challenge of trading using price channels is that these channels are frequently broken. As a result, a trader may get into a position only to see the prices go in a completely different direction. Needless to say, this can result in a loss.
There are various price channel types that you can trade through, but when it comes to Wolfe Waves, the most common channel is the Equidistant Channel. These are two parallel trend lines that would mark the boundaries of a current trend. The channels can be either bullish or bearish, depending on the direction of the market. You can access these channels through hourly charts, but also on longer-term timeframes.
Wolfe channels offer you an opportunity to trade through those price channels without that big of a risk. The main reason behind that is that a Wolfe wave will always occur within a specific price channel. In other words, if the price breaks outside of the Wolfe Wave pattern, it will most likely continue to go in the same direction.
This makes it much easier for you to predict a market direction, taking the appropriate position. For instance, if there is a price breakout of the Wolfe Wave pattern on the upper side, then you may enter a long position. At this point, you may anticipate the price going higher.
6 factors to consider before using Wolfe Waves and Gartleys

Before you begin using Wolfe Waves together with Gartleys, there are several factors that you should keep in mind. These are:
1. The Time Frame
Time frames are very important to consider when you are using Gartleys and Wolfe Waves. The good news is that both of these patterns can occur at any moment of the day, so their presence will mostly depend on the type of trader you are. So, take a close look at your trading style.
For instance, let’s say that you are a day trader. If that is the case, longer time frames may not be that convenient for you. Opt for shorter ones, going from 5 to 15 minutes. This will allow you to make a profit while potentially reducing losses.
On the other hand, if you are a swing trader, you may want to go for longer time frames instead. You can go for 1-hour or 4-hour frames, depending on your preferences. If you use a good trading strategy, this can lead to long-term profit.
Look for the lower lows and the higher highs on your chart and mark them. This way, you should be able to follow the direction of the trend, choosing the most profitable time frame.
2. The nature of the financial market
Next, you need to consider the nature of the financial market that you are currently trading in. Wolfe Waves and Gartleys can happen at any moment, which is why you need to understand the market that you are trading in.
For instance, if you are trading forex, you should know the fact that there are different currency pairs. Each of those pairs moves differently, so you need to know exactly how they are doing so. This is especially important if you are trading stocks, as the trading sectors can move differently from one another.
3. The indicators
When trading Wolfe Waves and Gartleys, you also need to keep note of the indicators that you are employing in your strategy. Both patterns may be used with different indicators, but you must learn exactly how they work.
For instance, if you make use of Fibonacci levels, then you need to learn how to use them to get the best results. On the other hand, if your strategy is based on moving averages, then you must learn how to interpret them correctly.
4. The strategy
Your strategy is a very important factor when trading with Wolfe Waves and Gartleys. Both patterns are usable with various strategies, but as with the indicators, you need to know how these strategies work.

For instance, if you are using reversal strategies, then identifying where the reversals are is an important part of using these patterns. On the other hand, if your strategy is based on following trends, you need to know where to look for these trends. Identifying them will determine where your opening and closing positions should be.
5. The risk
When you are trading, you are taking risks, which is also a factor that you should keep in mind. Indeed, Wolfe Waves may have fewer risks when used with price channels, but those risks are never zero. The good thing is that both Wolfe Waves and Gartleys may be used with various risk management strategies that can help you minimize the risk.
Like with the other factors, this will only work if you understand them. For instance, if your strategy uses stop-losses, then you should know exactly where to place them so that you can minimize the risk. The same thing applies to take-profit levels – so, if you want to make a profit from it, then you have to know where to place them.
6. The market trend
Last but not least, a very important factor to consider is the market trend. When it comes to Gartleys and Wolves Waves, you may use them in range-bound and trending markets alike. However, you need to understand exactly how those markets work and what they have to offer you.
For instance, if you are trading using a trending market, then you should have an eye for identifying trends. On the other hand, if you prefer working with the range-bound market, then you need to know how to identify the resistance and support levels.
Conclusion
The Wolfe Wave pattern is a strategy that is based on a false price breakout reversal signal that offers traders a high reward-to-risk ratio if price rightly moves in the opposite trend of the channel. The key to profitable use of the pattern relies on the strict observance of the symmetry of the waves and slope of the equidistant channel. Deep slopes allow for a greater chance of a complete reversal of the trend.
Start from $10, earn to $1000
+1 <span>Like</span>