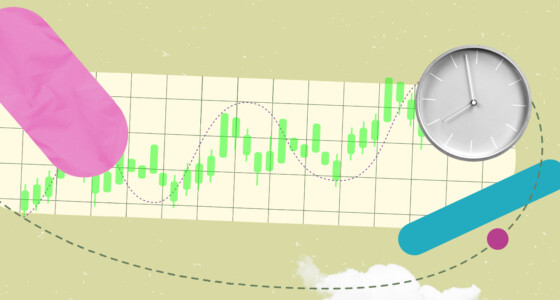

A stochastic oscillator is a well-known momentum indicator. It resembles an RSI indicator and provides similar signals. Still, there are differences in calculations and sensitivity.
The stochastic oscillator is used in numerous market conditions and is favored by investors and traders because its signals are very reliable. Keep reading to learn how to apply the indicator effectively.
Start from $10, earn to $1000
Stochastic indicator: fundamentals
George Lane developed the stochastic oscillator in the 1950s. Interestingly, although in most tutorials, an overbought/oversold market condition is considered the main stochastic signal, the creator said that divergences are the first and maybe the most vital trading signal stochastic provides.
Like all momentum oscillators, the indicator ranges between 0 and 100. It consists of two lines — %K and %D. %K is the main or fast line, and %D is a moving average of %K. It’s a so-called signal or slow line. Their interconnection is used to catch trading signals.
How to calculate %K and %D
%K = (the closing price – the lowest price for the period) / (the highest price for the period – the lowest price for the period) * 100
%D = simple moving average of %K
That is, the indicator compares an asset’s closing price to a range of its prices over a certain period.

Effective strategies in your mailbox
Subscribe and discover a fund of trading knowledge
Great! Please check your email
We’ve sent you an email to confirm your subscription
Something went wrong
Try reloading the page. If that doesn’t help, please try again later
How to use the stochastic indicator

Like with any other indicator, the stochastic oscillator’s signals depend on its settings. The settings determine how many signs the indicator will provide. The standard settings are 5, 3, and 3. For some strategies, investors prefer 8, 3, 3 or 14, 3, 3.
The lower the value, the larger the number of signals. If you use stochastic on low timeframes, you will be confused with numerous signals and market noise. Therefore, if you want to test low settings, you should use the indicator on higher timeframes. It’s a so-called fast stochastic indicator.
To reduce the number of signals, use more extensive periods. The indicator with large periods will be effective on lower timeframes. If you use it for long periods, you risk missing trading signals. It’s a so-called slow stochastic indicator.
How to read the stochastic indicator
As mentioned above, the indicator consists of two lines that range from 0 to 100. The key indicator levels are 20 and 80. The lines’ interconnection and their location provide various signals. There are three rules on how the stochastic indicator works.
Trading with up to 90% profit
- Overbought/oversold market. When the lines move above the 80 level, the asset is overbought and may decline soon. A common mistake of newbies is to sell the asset as soon as the indicator breaks above the 80 level. Stochastic may stay in the overbought zone for a long period. Therefore, the rule is to sell when it falls below 80. When the lines break below the 20 level, it’s an alarm that the asset is oversold. You can open a long position when the indicator rises above 20.
- Buy/sell signals. Another option to gain buy/sell signals is to consider the crossover of indicator and signal lines. When the indicator (%K) line crosses the signal (%D) line upside-down, it’s a sell signal. When the indicator line rises above the signal line, it’s a buy signal.
- Divergences. A divergence is one of the most reliable signals momentum indicators provide. When the price forms a lower low but stochastic rises, it’s a bullish divergence that signals an upward reversal. When the price forms higher highs while stochastic is falling, it’s a bearish divergence. You can expect the price to turn down soon.
Tip: never open a position after you get a signal from one indicator. Confirm it with a sign of another indicator or a chart pattern.

Stochastic indicator formula
To obtain the stochastic indicator, you first need to subtract the low of a specific period from the closing. Afterward, you divide it by the total period range, multiplying your results by 100. The standard formula is the following:
%K = (C – L14) / (H14-L14) * 100
Where:
· H14 = The highest price of the instrument within the last 14 days
· L14 = The lowest price of the instrument within the last 14 days
· C = The most recent closing price of the instrument
7 golden rules of trading
Everyone has their own trading style, but some principles are critical for success. Make sure you’re following these basic rules of trading.
Read more

How does the stochastic indicator work?
This indicator focuses on the location of the closing price of an instrument regarding the high-low range. To calculate the price, a set period is chosen, usually 14 days. The indicator will compare different closing prices with the last price movement. This way, they may predict a certain reversal point.
Stochastic indicators can be applied to pretty much any chart, with the two lines offering the necessary data. The value of the indicator will go between 0 and 100, comparing the current prices of the day with the recent highs and lows.
Previous periods usually contain 14 different individual periods. For example, let’s say that you have a weekly chart. In this case, the previous period will be at 14 weeks. Similarly, if you have an hourly chart, the previous period will be at 14 hours.
When you apply a stochastic indicator, you will notice a white line showing below your chart. This is your stochastic indicator, also referred to as the %K line. You will also see a red line, which is your %Ks moving average over three periods. This line is called a %D.
When the level of your stochastic indicator is at a high point, then the price of your instrument closed around the top of your 14-period timeframe. On the other hand, when the indicator is positioned at a lower level, it means the price is closed around the bottom.
The general rule for stochastic indicators is rather simple. If the market is in an uptrend, then the closing prices will be near the top (high). Similarly, if the trending market is in a downtrend, the prices will be near the bottom (low). If the prices begin to change from the lows or highs, slipping away, it might suggest a slowing of the momentum.
Stochastic indicators are often used to determine if there are any oversold or overbought readings. Many traders can use it to predict a trend reversal, as readings below 20 can suggest this. There are multiple strategies that one can use.
Stochastic indicators are the most effective when they are used in a broad trading range. A slow-moving trend would also use this indicator to make future predictions. This allows traders to decide whether closing is an appropriate move, given the data.
Stochastic oscillator example
The stochastic oscillator works on certain assumptions. One example is if you are in an uptrend, the closing price of the day is probably similar to the highest recent closing price. On the other hand, if you are in a downtrend, the day’s closing price will be very close to the lowest closing price of late.
Hypothetically speaking, let’s say that you have a 14-day timeframe. In this scenario, your high is $150, your low sits at $125, and your close is at $145. By using the formula, the stochastic indicator would look something like this:
%K = (145 – 125) / (150 – 125) * 100 = 80
As you compare the current price to the range, the stochastic indicator will be a reflection of consistency. The depending factor will be whether the closing price is in a downtrend or an uptrend.
Using our example, if you get an indicator of 800, then it suggests the asset risks being over-purchased. With this reading, it means your trading is close to the high-low range top.
Final thoughts
The stochastic oscillator is the effective indicator that provides various signals and can be used in multiple market conditions. Still, it has a significant pitfall — it’s too sensitive. Therefore, it may give fake alerts. To use it efficiently, you should test different parameters on various timeframes and develop your own approach.
Earn profit in 1 minute
<span>Like</span>