
Bullish candlestick patterns have a relatively reliable average success rate of 56%, provided they are analyzed right, yet remember that they do not guarantee a win. However, they are often difficult to read by traders, as they all hold similarities to one another.
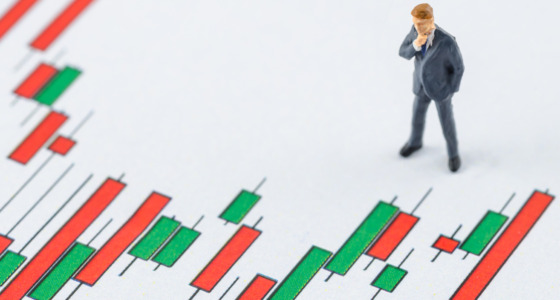
At the same time, for a day trader, candlestick chart patterns are the key to ensuring you make the right trends. These groups of “candles” will predict how prices are moving, giving you a signal as to whether you should buy after a downtrend or not.
Trading with up to 90% profit
What are candlesticks?
Candlesticks represent a good way of showing information about the price movement of a certain asset. There are many types of candlestick patterns, such as the bullish and bearish candlestick patterns or the Japanese candlestick patterns. That being said, the bullish pattern is one of the most commonly used ones.
Candle chart analysis showcases daily movement, finding continuation patterns, and determining whether there is any indecision on the market or not. Before you even begin trading candlestick patterns, you must familiarize yourself with the technique.
Effective strategies in your mailbox
Subscribe and discover a fund of trading knowledge
Great! Please check your email
We’ve sent you an email to confirm your subscription
Something went wrong
Try reloading the page. If that doesn’t help, please try again later
How to read a candlestick pattern
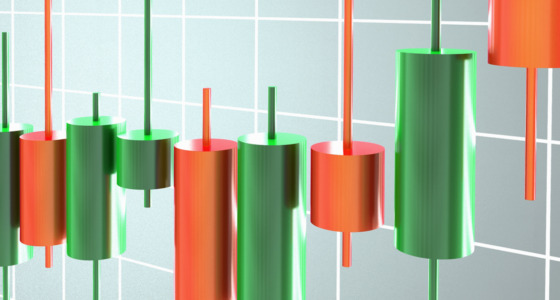
All candlestick patterns have three features they rely on, bringing forth the following information:
- The body of the candle, which is suggestive of the open-to-close ranges
- The color of the candle reveals the market direction: red or black shows a decrease in price, whereas green or white shows an increase
- The wick, also referred to as the shadow, shows the highs and lows of the day

The best way to read different candlestick patterns is to work on your entering and exiting trades. See what signals they give you, and if you can, use a demo account to practice your skills. Remember, no matter if you are using bullish or bearish chart patterns, you should use other technical analysis forms alongside them. This will improve the accuracy.
Bullish candlestick patterns
Bullish candlestick chart patterns tend to form after a downtrend in the market. When dealing with these candle chart patterns, you may want to open a long position if you wish to benefit from an upward trajectory. Here is a list of candlestick patterns in the bullish category.
Earn profit in 1 minute
1. Hammer
Hammers have a short body with a long wick at the bottom, usually found in a downward trend. Hammers suggest that even if there were selling pressures throughout the day, with people originally not buying, a strong buying pressure ultimately appeared and got the prices up. Colors can vary, but the green one is considered one of the best candlestick patterns.
2. Inverse hammer
The inverse hammer, like one may guess, is similar to the regular hammer – only this time, the longer wick is up and there is a shorter wick at the bottom. It suggests that there was a buying pressure, but not strong enough to bring the prices down, eventually giving the buyers full control.
3. Piercing line
Piercing candle chart patterns are multiple charts that firm themselves after a downtrend, suggesting a reversal. They are usually formed by two candles – a bearish candle that indicates a downtrend is continuing, and a bullish candle that opens the gap. A trader can get into a long position if a bullish candle starts forming the next day.

4. Bullish engulfing
Bullish engulfing shows a multiple chart pattern of candlesticks that form in a downtrend. In this chart, the second candle engulfs the first one, suggesting that the downtrend continued, but the bulls placed it back on the market.
5. Three white soldiers
This pattern will appear over three days in candle chart analysis. It features three white (or green) candles with small wicks that go higher every day. If it appears after a downtrend, it means that the buying pressure is advancing steadily.
6. Morning star
As the name suggests, the Morning Star shows that a bleak downtrend can still reverse, bringing hope to buyers. This candlestick pattern features three candles: one short candle placed between a long red candle and a long green candle. When you see this, it means that the first-day pressure is going down, with the bull market closing in.

5 best coffee types for traders
Coffee is a great beverage for traders. A few daily cups of coffee improves the mind and enables you to make better trading decisions. Check it out!
Read more

What is the most bullish candlestick pattern?

The ascending triangle pattern and the bullish engulfing pattern are the most popular options when it comes to candlestick patterns. This makes them the most bullish ones. With that in mind, it is very important to look for bullish confirmation as well.
Like with other technical analysis forms, it’s important to understand that there aren’t any guaranteed results. Other metrics should be used so that you may determine its bullish potential and take the best trading decision.
What is a spinning top candlestick pattern?
Spinning top candlestick patterns (also referred to as doji) are candlestick patterns that have two long shadows and a short body. This suggests that the prices fluctuated over the trading timeframe before they closed around the opening price. When it comes to technical analysis, this means that neither sellers nor buyers possess the upper hand in here.
What is a bullish belt hold candlestick pattern?
The bullish belt holds are patterns that show a decline in prices, followed by a time of significant gain. When used in technical analysis, they’re suggestive of a reversal after going through a downtrend. Traders can use this information to decide whether they should buy or sell.
Like with other technical analysis forms, traders need to practice care and wait until they receive bullish confirmation. Even if that confirmation is received, there is no guarantee that such a pattern will play out. You may want to use other technical indicator analyses to come up with a decision.
The bottom line
As a trader, you should learn candlestick pattern movements when deciding your next trade. That being said, there is still a fair margin of error with these predictions, which is why you may want to use best candlestick patterns alongside other technical analysis tools. We’ll be back with more information on bearish candlestick patterns.
Start from $10, earn to $1000
+2 <span>Like</span>