
A moving average is a well-known technical tool. Although it’s a lagging indicator, which means that signals arise with a delay, they are very reliable. Moving averages can be used alone or together, but the reliability of their signals doesn’t weaken.
Start from $10, earn to $1000
Did you know that the 50-day moving average fell below the 200-day average before the major market crashes that occurred in 1929, 1938, 2008, and 2020? Keep reading if you’re wondering how to use moving averages to buy stocks.
A moving average for stocks: meaning
A moving average (MA) is a trend indicator consisting of one line that follows the price fluctuations. It’s applied directly to the price chart, and its key parameter is the period. The standard periods are 50, 100, and 200 for longer-term periods (starting from 4 hours) and 9, 12, and 26 for shorter periods (up to 4 hours). For instance, if you trade on a 5-minute timeframe and apply the 9-period moving average, the indicator will calculate the nine previous 5-minute candles. The calculation is usually based on close prices. However, the setting can be changed for various strategies.
The key rule is that the longer the period is, the smoother the signals are. Thus, the MA will provide fewer signals, but they will be more reliable. Long periods suit high timeframes. Short-period MAs work on lower timeframes and provide signals more quickly.
There are different types of MAs, including simple, exponential, linear-weighted, and smoothed. Generally, investors use the simple and exponential types.
Effective strategies in your mailbox
Subscribe and discover a fund of trading knowledge
Great! Please check your email
We’ve sent you an email to confirm your subscription
Something went wrong
Try reloading the page. If that doesn’t help, please try again later
Why use a moving average?
One reason to use a moving average to buy stocks is that it can help smooth out fluctuations in the price of a stock, making it easier to identify trends. This can be especially useful for investors who are looking to hold stocks for the long term as it can help them avoid buying at the top of a short-term price spike or selling at the bottom of a short-term dip.

Another reason to use a moving average is that it can help to identify potential entry and exit points for buying or selling stocks. For example, if a stock’s price is above its moving average, it may be a good time to buy, while if it is below its moving average, it may be a good time to sell. This can be particularly helpful for investors who are trying to time the market, as it can provide a simple, objective way to make buy and sell decisions.
Finally, using a moving average can also help to identify potential support and resistance levels for a stock’s price. If a stock’s price is consistently bouncing off its moving average, it may indicate that the moving average is acting as a support or resistance level for the stock. This can be useful for investors who are trying to determine where to set stop-loss orders or other risk management strategies.
Types of Moving Averages?
Some of the most common types of moving averages include the simple moving average (SMA), the weighted moving average (WMA), and the exponential moving average (EMA).
Trading with up to 90% profit
1. Simple moving average: This is calculated by taking the average of a given number of past prices, typically over a period of 20 to 200 days. This type of moving average is easy to calculate and is often used by investors as a quick and simple way to identify trends in stock prices.
2. Weighted moving average: This gives more weight to recent prices, making it more responsive to recent price changes than the simple moving average. This type of moving average is often used by investors who want to more closely follow short-term trends in stock prices.
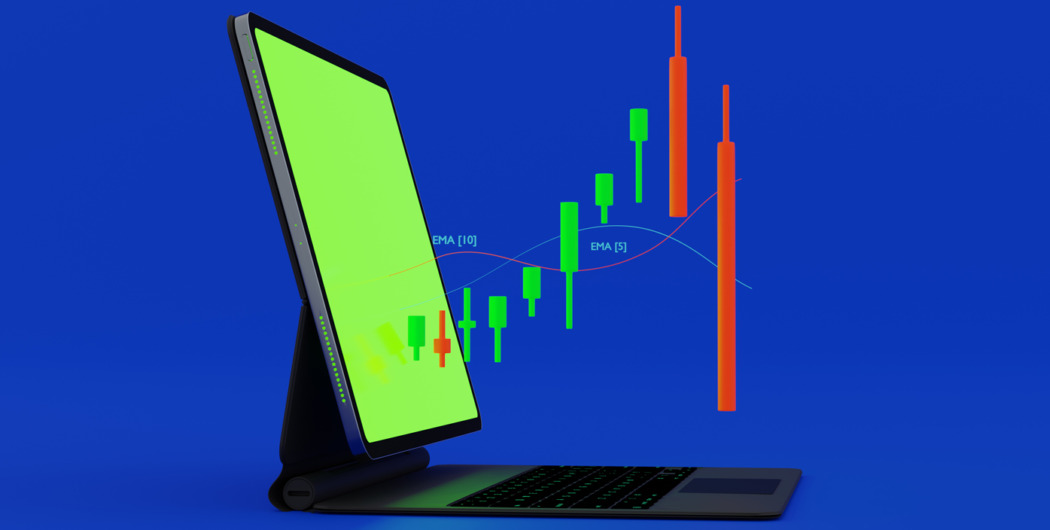
3. Exponential moving average: This is similar to the weighted moving average, but it gives exponentially more weight to recent prices, making it even more responsive to recent price changes than the weighted moving average. This type of moving average is often used by investors who are looking to quickly identify and act on short-term trends in stock prices.
Overall, the type of moving average that is best for buying stocks will depend on an investor’s individual trading style and goals. Some investors may prefer the simplicity of the simple moving average, while others may prefer the added responsiveness of the weighted or exponential moving average.
Below, you will find three ways to use simple moving averages to buy stocks.
How to start trading with $200 and minimum risk
Don’t let a small budget deter you from trading! Learn how to start trading with $100 or $200 and make the most out of this money!
Read more

1. Trend
The first application of the moving average indicator is to determine a trend. If you know an overall trend, you can simply buy or sell stocks. It’s enough to implement only one moving average.

A moving average follows an asset’s price movements. Therefore, when the line moves up, it’s a bullish trend. When it goes down, it’s a bearish trend.
The period of the moving average will depend on the timeframe you trade on. The signal will be more effective on higher timeframes because the moving average is a lagging indicator. If you use it on a short-term timeframe, you risk missing a change in the trend.
Trend trading is one of the most popular approaches. The only challenge is to define a trend reversal. However, you can also apply MAs to find the end of the trend.

2. Crossover
You have probably heard of golden and death crosses, even if you are a beginner. These are patterns that imply a combination of two lines to get signals, but investors like to add three MAs. They occur when MAs with different periods cross each other.
- The golden cross occurs when the MA with a shorter period breaks above the MA with a longer period. It’s a buy signal, so you can buy stocks.
- You can sell stocks when the MA with a shorter period falls below the longer MA. This breakout pattern is called the death cross.
The key to success is to determine periods of moving averages correctly. Stick to the main rule of using the most common periods for long and short timeframes.
On low timeframes, it’s best to combine MAs with 9 and 26 periods. On high timeframes, you should apply moving averages with periods of 50 and 200. You can develop your own strategy that will involve MAs with other periods.
It’s vital to remember that the moving average is a lagging indicator. The reversal signal will appear with a delay. It’s an advantage if you plan to trade in the direction of a newly formed trend. When using the lagging signal, you get additional confirmation of the trend direction.
However, this signal may not be so effective if you buy stocks for a short period. You risk missing a perfect entry point. Moreover, this signal isn’t good if you trade in the direction of the previous trend, as you may miss a perfect exit point.

3. Support and resistance
Moving averages are also used to find reliable support and resistance levels. If you check the price chart and implement a moving average, you will see that the price rebounds from the MA in most cases. Therefore, if you plan to buy stocks and see the asset is trading above the MA, you can expect it to rebound and keep rising. However, if the price moves to the MA that is placed above it, you better avoid buying the stocks and wait for the price to break out.
If you need to sell stocks, you should look for a rebound from the MA that lies above the price. If the asset falls towards the moving average, you should wait for it to break below the MA. Otherwise, there are risks the price will rebound and move up.

Takeaway
The moving average indicator is one of the most effective tools to determine the price direction and buy and sell stocks in a strong trend. However, you should remember that it’s the lagging indicator. Therefore, it works better on longer-term timeframes. To confirm its signals, apply other indicators with similar purposes.
Earn profit in 1 minute
+2 <span>Like</span>