
Forex is a place where you need to spot opportunities at the right time. In 1987, for example, Andrew Krieger was working for Bankers Trust when he spotted an opportunity to profit from the declining value of the New Zealand dollar. He opened a massive trade against the NZD; in fact, it was so large that it represented more than twice the entire money supply of New Zealand. Krieger’s trade is still regarded as one of the most audacious and successful ones in the market.
Many trading opportunities in Forex won’t be immediately visible to the naked eye. In such cases, technical indicators serve as a valuable tool for traders and provide signals prompting a certain action. Let’s take a closer look at indicators in general, as well as some commonly used ones.
Earn profit in 1 minute
What is a technical indicator?
A technical indicator is a tool for analyzing price trends and predicting future price movements in the market. Think of it like a magnifying glass that helps you zoom in on specific market conditions that you may not see just by looking at the сhart. Based on the readings, you can make decisions about buying or selling assets.
Technical indicators come in different shapes and sizes, but they all have one thing in common: they use mathematical calculations based on historical price to generate trading signals.
Effective strategies in your mailbox
Subscribe and discover a fund of trading knowledge
Great! Please check your email
We’ve sent you an email to confirm your subscription
Something went wrong
Try reloading the page. If that doesn’t help, please try again later
Types of technical indicators

With so many different types of indicators available, how do you know which ones to use? Let’s start by defining the different types of indicators in trading:
Trend-following indicators
The purpose of trend indicators is to identify and confirm the direction of a trend in Forex and other financial markets. These indicators typically analyze the price action of an asset over a period of time to determine whether it is trending up, down, or sideways. While their primary focus is to confirm trends, you can also use them to identify potential entry and exit points.
A couple of examples of trend-following indicators are moving averages and Ichimoku Kinko Hyo.
Oscillators
These indicators help identify price strength and determine entry and exit points. They are called oscillators because they oscillate between fixed values, usually 0 and 100. When the oscillator value is above a certain level, it indicates an overbought condition. Values that are below another level suggest an oversold condition.
Stochastic oscillator, Relative Strength Index (RSI), and Awesome Oscillator (AO) all fall under this category.
Volatility indicators
The second broad category is volatility indicators, which measure the magnitude of price movement. They also help with entry and exit points, but in this case, by analyzing the level of price movement. Essentially, volatility indicators reflect market volatility and the trader determines entry/exit points based on that.
Here are a few examples: Average True Range (ATR), and Bollinger Bands.
Volume indicators
Volume indicators analyze the total number of assets traded over a specified period of time, i.e., measure the level of buying and selling activity. These indicators offer insights into market sentiment and help traders identify potential opportunities.
Examples of popular volume indicators include On-Balance Volume (OBV), Volume-Weighted Average Price (VWAP), and Money Flow Index (MFI).
How volatility and liquidity of a currency affect your choice
Highly volatile currencies are more likely to experience sharp price movements. These sharp price changes can lead to a large number of false signals when using technical indicators, especially when using short indicator periods.
Start from $10, earn to $1000
On the other hand, less volatile currency pairs may not provide as many favorable opportunities for traders. But technical indicators are less likely to provide inaccurate trading signals, as there are fewer sudden price movements to account for.

As for liquidity, highly liquid currency pairs tend to have more accurate and reliable price data, which makes it easier to use technical indicators effectively. For instance, some indicators require significant price movements to generate signals. And in less liquid markets, such movements may be harder to come by.
7 golden rules of trading
Everyone has their own trading style, but some principles are critical for success. Make sure you’re following these basic rules of trading.
Read more

How timeframes affect your choice
In shorter timeframes, indicators tend to generate more frequent and faster signals. At the same time, there is a downside in that it generates a higher number of false signals due to market noise. The opposite is also true: in longer timeframes, they tend to generate fewer signals. But these signals are usually more reliable since they are based on more extended periods of price data.
For example, if you’re looking to make quick trades, consider choosing a shorter timeframe (like a 5-minute or 15-minute chart) and use indicators with shorter periods for more frequent signals. In contrast, if you’re looking to hold positions for a more extended period, a daily or weekly chart and indicators with longer periods will be more reliable.
How a trading strategy affects your choice
Here is how a trading strategy affects your choice of indicators and which indicators are best suited for different trading approaches:
Day trading
One of the main reasons that day trading requires its own set of indicators is the need to make decisions based on short-term market movements. By using indicators that are tailored to the unique characteristics of day trading, like short-term moving averages (5-, 8- and 13-bar) and oscillators, day traders can time their positions better. Also, price action indicators can help identify key levels where buying or selling pressure is more likely to occur.
Scalping
Scalping is focused on even smaller, shorter price movements, so the timing for identifying trends and momentum in the market is even more critical. In this scenario, indicators need to be extra sensitive to small price changes and provide immediate feedback. The best Forex trading indicator is arguably Simple Moving Average (SMA), with Exponential Moving Average (EMA), RSI, and Parabolic SAR also being quite useful.
Swing trading
Here, you need technical indicators to identify medium-term market trends. These trends can last anywhere from a few days to a few weeks, and swing traders try to capture a portion of the trend. So, you don’t need the indicator to be as sensitive to small price movements. For example, you can adjust the period length or smoothing factor of a moving average. Other great options for swing traders are Volume, RSI, and Stochastic.
Position trading
Position traders are more interested in long-term trends. Therefore, indicators that are set for shorter-term trading won’t necessarily be suitable for position trading. For insights into potential entry and exit points in long-term positions, consider using a 50-day simple moving average, Fibonacci Retracement, and Stochastic RSI.
Trend trading
The obvious choice is trend-following indicators and oscillators, as you need to be able to identify the direction and strength of the trend, as well as potential entry and exit points. Overall, your choice will likely fall on the most popular Forex indicators mentioned a few times already, and there’s nothing wrong with that. You just need to set the parameters properly—not too sensitive or too sluggish for the current market conditions.
Essential indicators for Forex trading
Whether you’re a seasoned pro or a newbie, there is a list of indicators everyone will benefit from using. Here are five useful indicators that will give you the insights you need to make informed trading decisions:
RSI
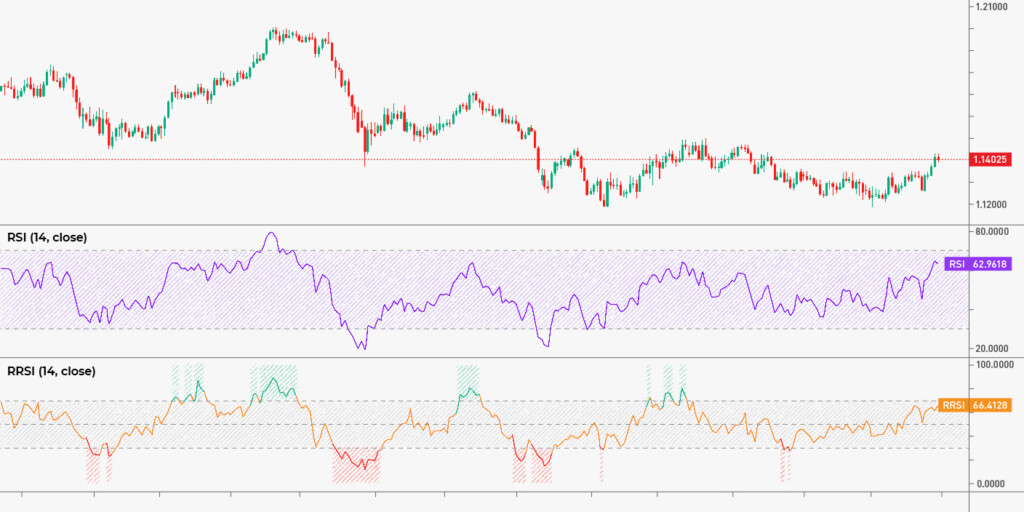
When it comes to technical analysis for Forex, a momentum oscillator RSI is indispensable. The indicator measures the magnitude of recent price changes to evaluate overbought or oversold conditions in the market. The RSI ranges from 0 to 100, and it signals potential trend reversals when reaching extreme levels.
Let’s say you’re trading a currency pair using the RSI indicator. If the RSI indicator shows over 70, it suggests the market is overbought and may be due for a reversal. Less than 30 points to an oversold market. When the price is above 50, the market is bullish, if the price is below 50, the market is bearish, and the indicator also generates buy/sell signals based on the bullish/bearish divergence.
MACD
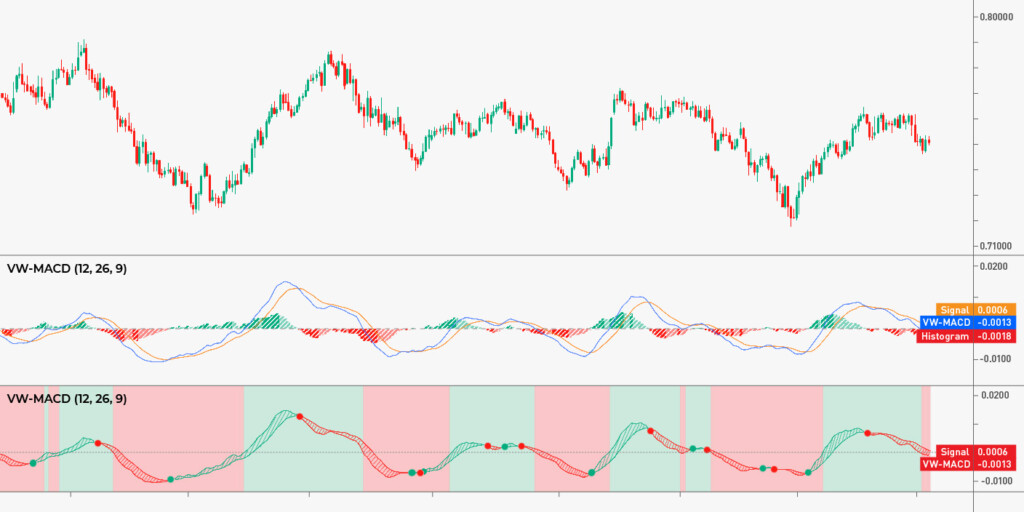
MACD is a trend-following momentum indicator that consists of two lines—the MACD line and the signal line—and a histogram that shows the difference between the two lines. When the MACD line crosses above the signal line, it’s a bullish signal. And when the MACD line crosses below the signal line, it’s potentially a sell.
It’s worth adding that when the MACD rises above 0, it signifies a bull market; when it’s lower—bearish. Traders can also determine the divergence between the price and the indicator, and determine whether to buy or sell based on it.
Bollinger bands
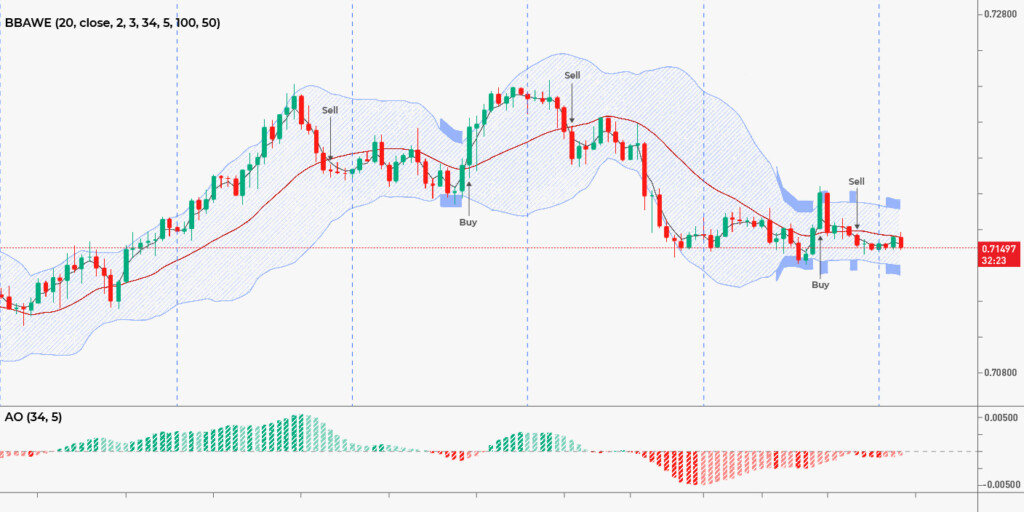
Bollinger Bands consist of three lines—the upper band, lower band, and a middle line —calculated based on the price’s standard deviation. When the market is experiencing low volatility, the upper and lower bands are close to the middle line. During high volatility, the bands will be further away.
In addition to low and high volatility, Bollinger Bands can signal traders to buy when prices are above the middle line and sell when prices are below it. Usually, when prices go above the upper line, you can expect a price reversal to the downside. When it’s below the lower band, the price may rise soon.
Stochastic
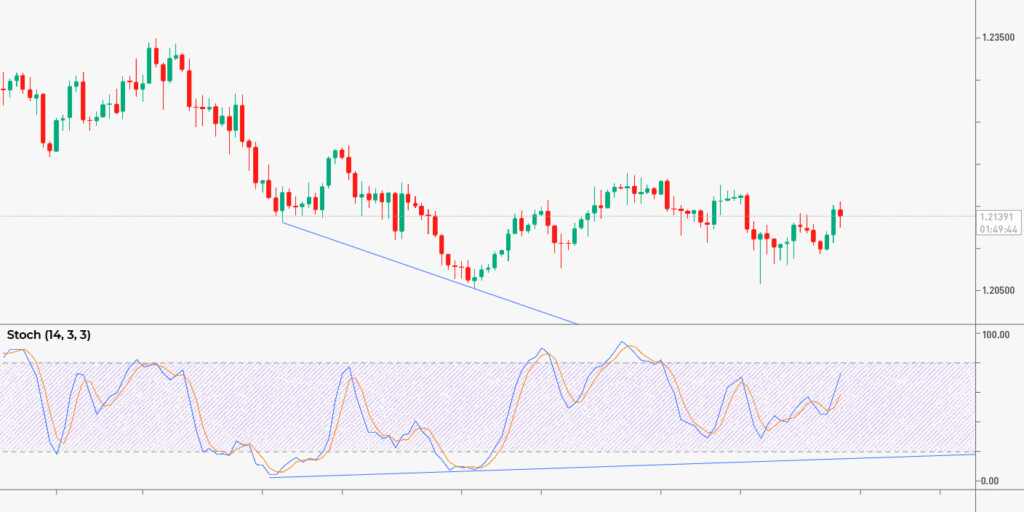
The next indicator for your toolkit is the Stochastic oscillator, used to measure the momentum of price movements. It compares the closing price of a currency pair to its price range over a specified period, typically 14 periods. When the readings reach 80 or above, the asset’s considered overbought, and 20 or below means it’s oversold.
You can also get signals from line crossovers: when the %K line crosses above the %D line, interpret it as a bullish signal. The %K line crossing below the %D line points to a bearish signal. When the Stochastic Oscillator fails to confirm a new high or low in price, it creates a divergence.
Moving averages
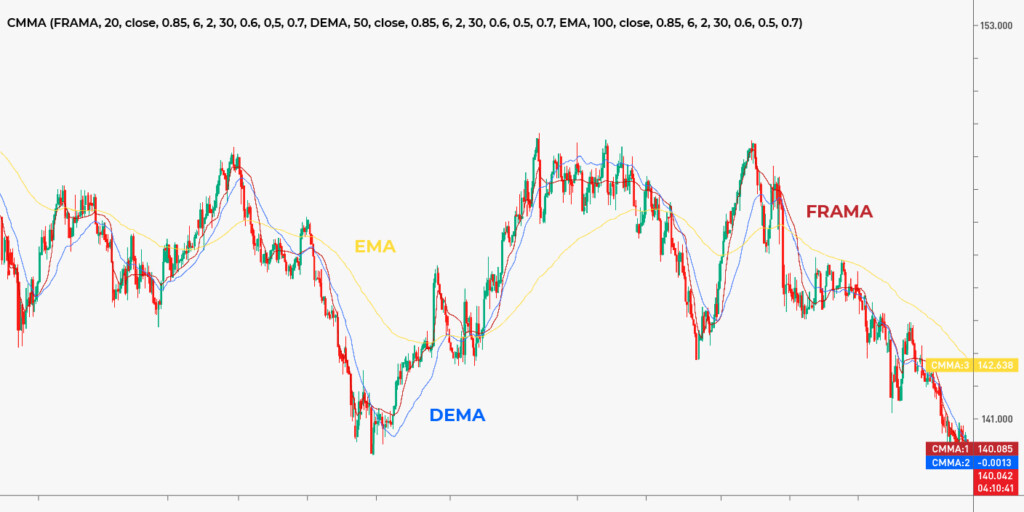
Moving averages are one of the most widely used technical indicators in Forex and most other markets, too. When the price is above the MA, it suggests an uptrend, and as the price gets below the moving average, you’ll be looking into a downtrend territory.
There are also insights to be gained from MA crossovers. For example, a bullish signal is produced by a shorter-term MA crossing above a longer-term MA. A shorter-term MA crossing below a longer-term MA points to a bearish trend.
How to combine indicators
There are a few strategies for combining Forex technical indicators:
- Overlapping – You can plot indicators like MACD and RSI on the same chart, and they’ll provide a more detailed view of the market. You’ll be looking for crossovers and divergences between them to spot buying and selling opportunities.
- Complimentary – Here, the goal is to capture different types of information about the market. For example, Bollinger Bands and ATR can be used together to be better informed on market volatility. The first will show the price range, while the second will inform about the average size of price moves.
- Confirmation – In this combination, indicators are usually based on different methodologies and may have different timeframes.
Conclusion

Technical indicators are valuable tools for Forex traders, and you should apply different ones depending on the market circumstances, your trading approach, and the timeframes you’re trading. It’s also important to use them in combination with each other. This way, you’ll reduce the likelihood of false signals and improve the accuracy of your readings.
Ultimately, successful Forex trading requires a combination of technical analysis, fundamental analysis, and risk management strategies. Technical indicators are just a part of a well-rounded trading plan. And now you know how they’ll help you make sense of the complexities of the Forex market.
Sources:
Could a trader using only “old” technical indicator be successful at the Forex market? ScienceDirect
Scalping vs. swing trading: what’s the difference? Investopedia
Position trader – overview, approaches to position trading, Corporate Finance Institute
Forex trading with multiple chart indicators, BabyPips
Trading with up to 90% profit
<span>Like</span>