
A trading strategy is crucial for successful trading. A trader is unlikely to succeed when opening trades blindly without a particular trading approach. A trading strategy includes specific entry and exit points based on certain price movements. These movements are highlighted by signals of such technical analysis tools as chart patterns, candlesticks, and technical indicators. A strategy works if only the signals are correct. Therefore, the choice of indicators is essential.
Read on to learn how to choose and combine technical indicators so they can help you trade successfully.
What is a technical indicator?
An indicator is a technical analysis tool calculated with a particular mathematical formula based on price, volume, and open interest historical data. Could you imagine that 80% of all professional traders rely on technical analysis, while only 20% prefer fundamental analysis?
Indicators inform traders and investors about particular market conditions that can be used for predicting future price trends.
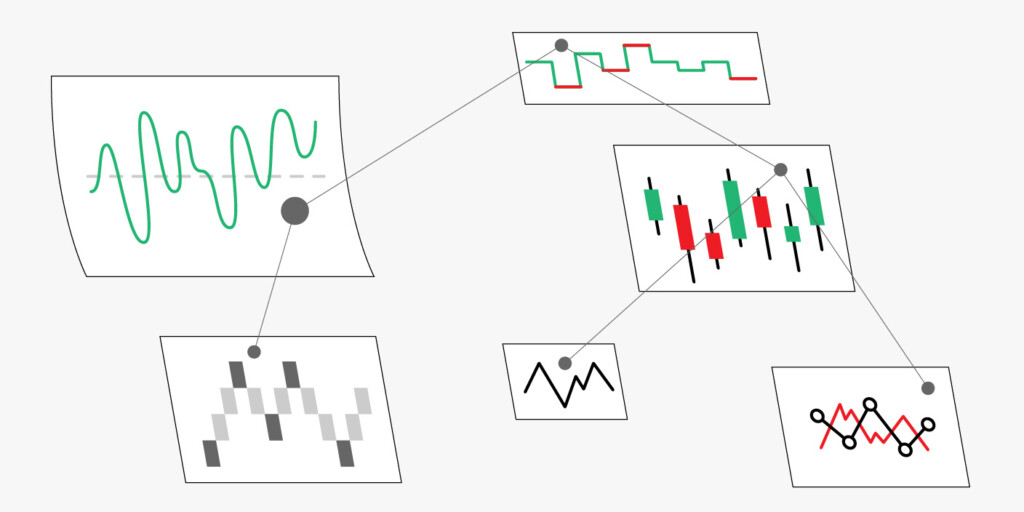
There are several indicator types. The most common classifications are:
- Trend indicators. These tools reflect the market trend and measure its strength. Trend indicators are lagging, meaning their signals appear with a delay.
- Volume indicators. These indicators reflect the interest in an asset and the strength of buyers and sellers.
- Volatility indicators. These tools show the degree of price fluctuations.
- Momentum indicators. These indicators determine the speed of price movements. Most momentum indicators are leading, so they can be used for quick signals.
Effective strategies in your mailbox
Subscribe and discover a fund of trading knowledge
Great! Please check your email
We’ve sent you an email to confirm your subscription
Something went wrong
Try reloading the page. If that doesn’t help, please try again later
Do technical indicators work?
Technical indicators do work, but if only used correctly. The correctness is determined by a few factors, including an asset, a timeframe, parameters, and confirmation.
Asset
Although technical indicators are standard, it’s worth considering what asset you trade. For instance, stocks are more volatile than major currency pairs. Therefore, lagging indicators will work better on a currency chart and may be too slow to provide signals on a stock chart with significant price fluctuations.
Timeframe
A timeframe determines how quickly you close trades. Using lagging indicators on low timeframes may be risky. Therefore, scalpers and day traders prefer momentum indicators. When trading in longer periods, traders use trend indicators as momentum ones may create market noise.
Parameters
Indicators can be effective on any timeframe with their standard settings. Still, it’s worth changing their parameters regarding a timeframe. A common rule is that longer indicator periods are more effective on higher timeframes, while shorter periods are better for lower timeframes.
Confirmation
Even the most reliable indicators can’t deliver 100% accurate signals. Therefore, every indicator alert must be confirmed with another technical tool, including candlesticks and chart patterns.
How to use technical indicators?
It’s enough to learn an indicator’s parameters and signals correctly. However, it’s still impossible to know all of the tools. Therefore, you can choose several indicators you like and practice trading with them or start with the most popular ones.
What are the most used technical indicators?
The most used indicators are those that have proved their reliability over the years. They include:
- Moving average. Every trader has ever used a moving average. It’s a simple but solid tool to identify a trend direction.
- Moving Average Convergence Divergence (MACD). This indicator is based on the abovementioned moving average. It is widely used to determine a trend reversal.
- Relative strength index (RSI). It’s an oscillator commonly used to identify overbought and oversold market conditions and a trend reversal.
- Bollinger Bands. It’s a volatility indicator, which is also used to identify potential reversal points.
- Fibonacci levels. Fibonacci retracement and extension is a well-known tool that predicts a price reversal.
Trader’s level test
Answer 7 short questions and define your level as a trader. Take the test now to evaluate your real knowledge!
Start test

How many technical indicators should I use?
Beginner traders believe that the more tools they use, their strategy will be more effective. However, it’s a delusion. The theory says it’s enough to implement two-three indicators. What are the best technical indicators to use together? The best technical indicators to combine are those of different types. If you add two momentum indicators that provide similar signals, they won’t confirm but copy each other. Traders usually combine trend and momentum tools. Volume and volatility indicators are used as additional methods of market analysis.
Takeaway
Technical indicators are simple and don’t require deep knowledge. You only need to learn their best parameters and signals to implement them in your trading strategy. If you aren’t confident, start with the most popular tools, test them on a demo account, and make notes about every trade. Remember that every signal must be confirmed.
Sources:
Technical analysis: Staying on top of the ups and downs, Financial Times
Technical Indicator: Definition, Analyst Uses, Types and Examples, Investopedia
+1 <span>Like</span>