

The Elliott Wave theory is one of the cornerstones of successful trading. Still, only a few traders use it because it’s complicated and requires deep knowledge. However, by mastering the Elliott Wave principle, you can develop a reliable and highly effective trading strategy for any financial market.
Start from $10, earn to $1000
What is the Elliott Wave theory?
The Elliott Wave theory, also known as the Elliott Wave Principle, was developed in the 1930s by Ralph Nelson Elliott. He based his thesis on the assumption that financial markets move in repetitive cycles – waves.
You need less than 30 minutes to learn the Elliott Wave Principle. Did you know that Elliott studied 75 years’ worth of daily, weekly, monthly, and yearly charts of various indexes and even made hourly and 30-minute charts by himself?
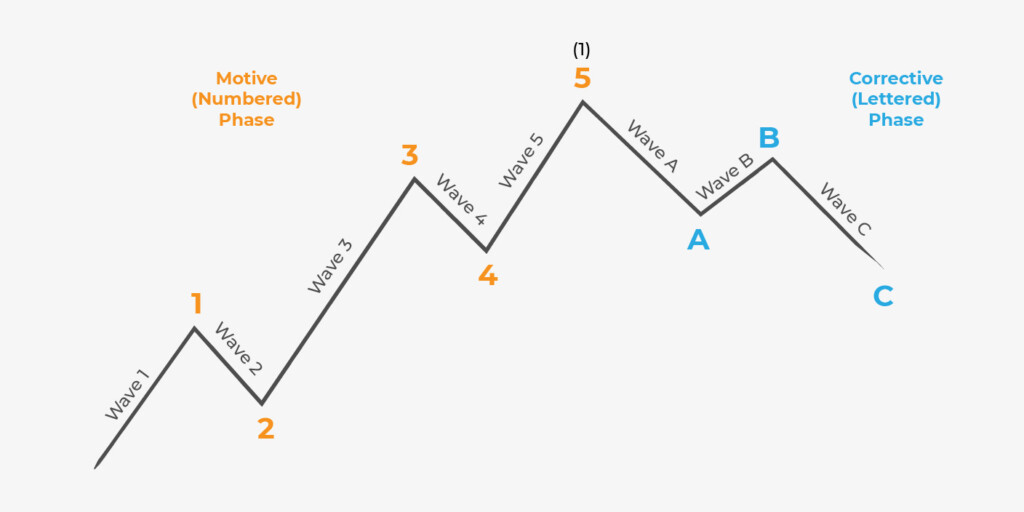
According to the Elliott Wave principle, one cycle of price movement consists of five-wave advancement and three-wave retracement.
Effective strategies in your mailbox
Subscribe and discover a fund of trading knowledge
Great! Please check your email
We’ve sent you an email to confirm your subscription
Something went wrong
Try reloading the page. If that doesn’t help, please try again later
How to construct waves
The Elliott waves are divided into motive, or impulse, and corrective.
Impulse wave
An impulse wave is the primary trend wave that moves in the trend direction. You can see it on the image under the 1, 3, and 5 labels. The impulse wave also includes corrective waves 2 and 4. These waves are formed opposite to the overall trend and are retracements of impulse waves.
To validate this formation, the following requirements must be met:
- Wave 2 shouldn’t be below the point where wave 1 started.
- Wave 3 shouldn’t be the shortest among impulse waves.
- Wave 4 shouldn’t interconnect with wave 1.
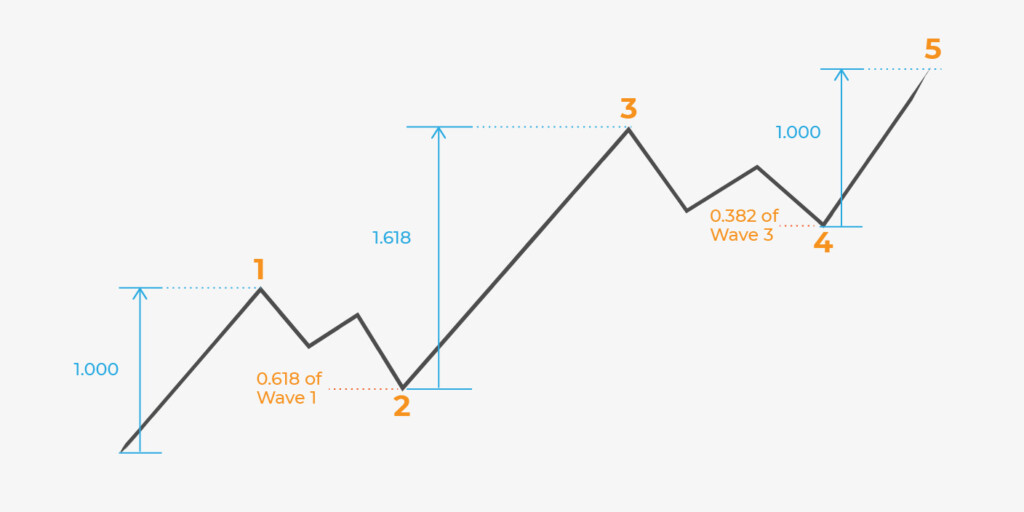
The theory recommends that traders implement Fibonacci tools for more reliable signals.

The distance between the waves is determined with retracements for corrective waves and extensions for impulse waves. Usually, traders use the 0.618 retracement of wave 1 to find wave 2. Wave 3 appears at the 1.618 Fibonacci extension of wave 1. Wave 4 is usually shallow — it retraces around the 0.382 of wave 3.
Corrective waves
Corrective waves, also known as diagonal waves, include three – or a combination of three – sub-waves. They move in the opposite direction to the overall trend of a larger degree and are labeled with letters A, B, and C.
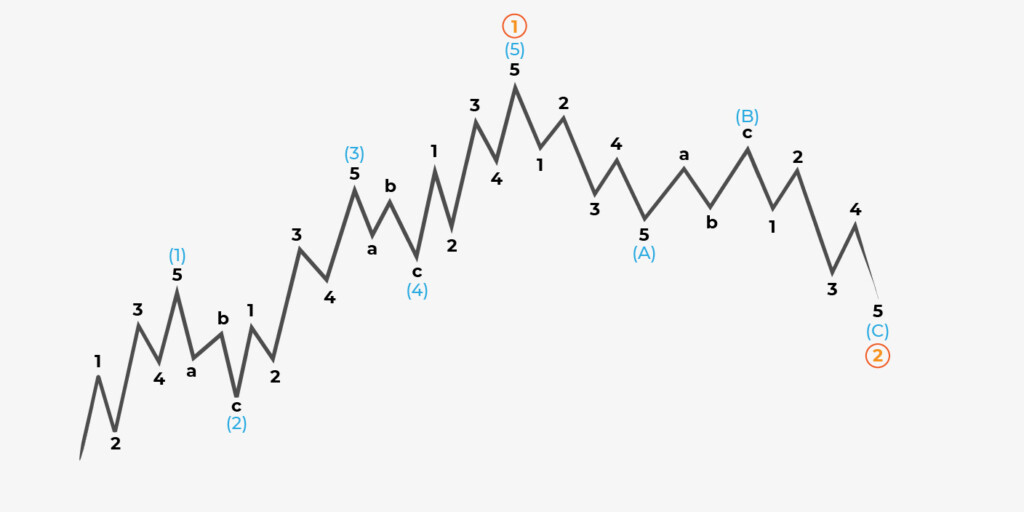
You may be confused because it was mentioned above that two corrective waves and three impulse waves form one big impulse wave. Here, it’s vital to learn another wave feature.
Waves appear in different timeframes. Therefore, one wave of a larger degree includes several waves of a lower degree. Generally, there are 9 degrees – Grand Super Cycle, Super Cycle, Cycle, Primary, Intermediate, Minor, Minute, Minutte, and Subminutte, where Grand Super Cycle appears in weekly and monthly timeframes, while the Subminuette degree appears in minute periods.
Below, you can see how an impulse wave of the highest degree (1) and the corrective wave of the highest degree (2) are subdivided into waves of smaller degrees, which are subdivided into waves of even smaller degrees.
Corrective waves: types
Corrective waves have different variations with their own rules and signals.
Earn profit in 1 minute
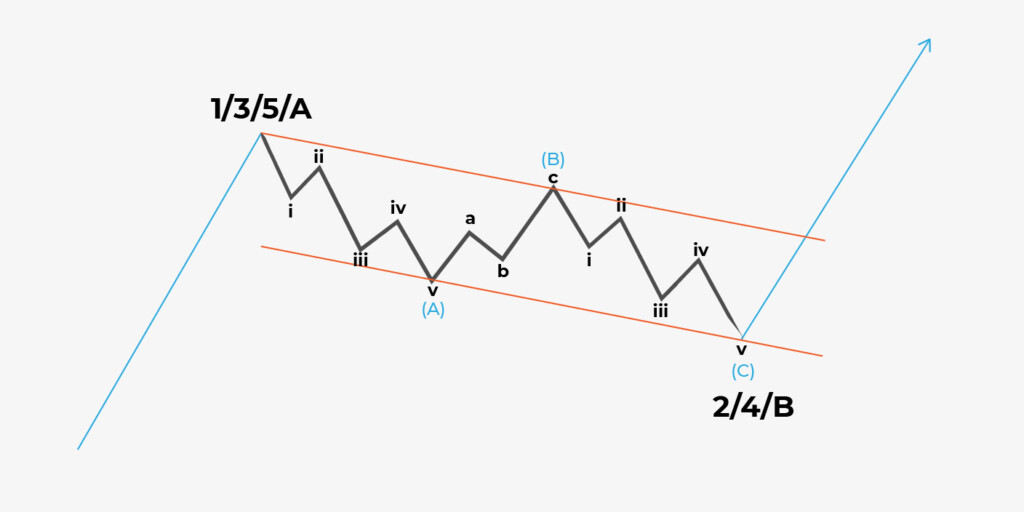
ZigZag
An aggressive correction in wave 2 of an impulse wave is called ZigZag. It includes 5, 3, and 5 moves. That is, wave A consists of five waves, wave B is a corrective ABC formation of a lower degree with three waves, and wave C is impulse and consists of five waves.
Flat
Another formation is called Flat. It has three types – running, expanding, and irregular. The Flat should appear in wave 4 of the impulse. The difference between the Flat and ZigZag setups is the relation between waves A and C. Also, in a Flat formation, wave A includes three waves. The Flat is a 3-3-5 correction.
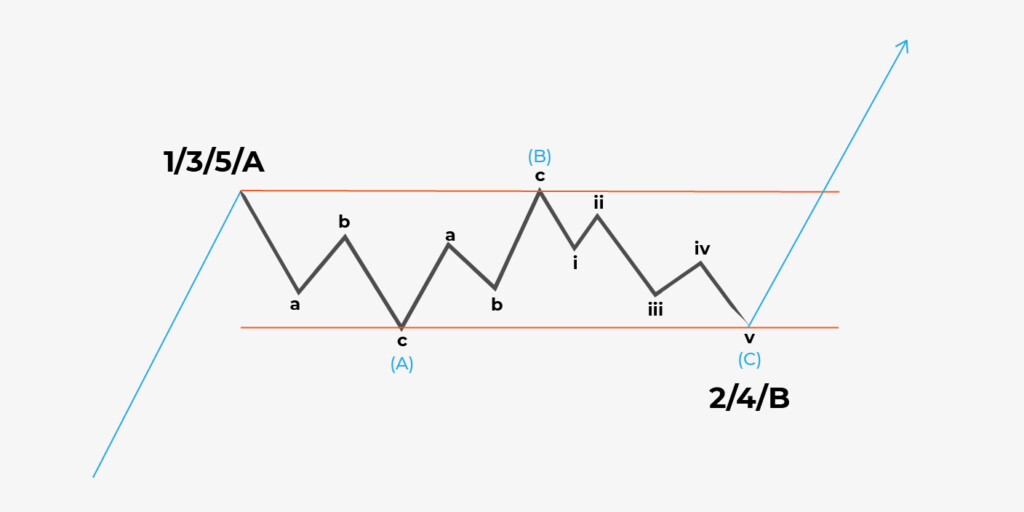
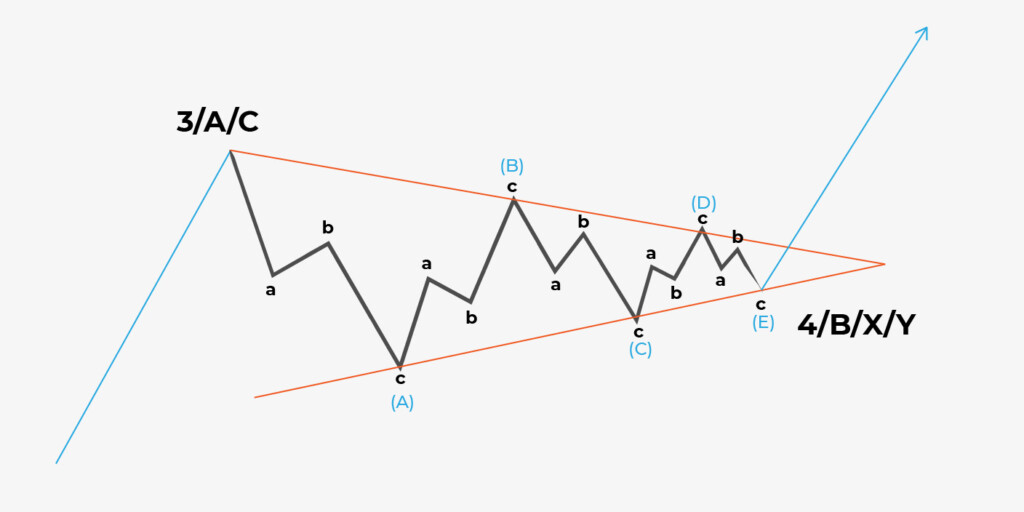
Triangles
A triangle is a five-wave setup that can appear as wave 4 or be formed in corrective wave B of an ABC correction. There are three types of triangles – symmetrical, descending, and ascending. Each triangle’s wave is subdivided into three waves.
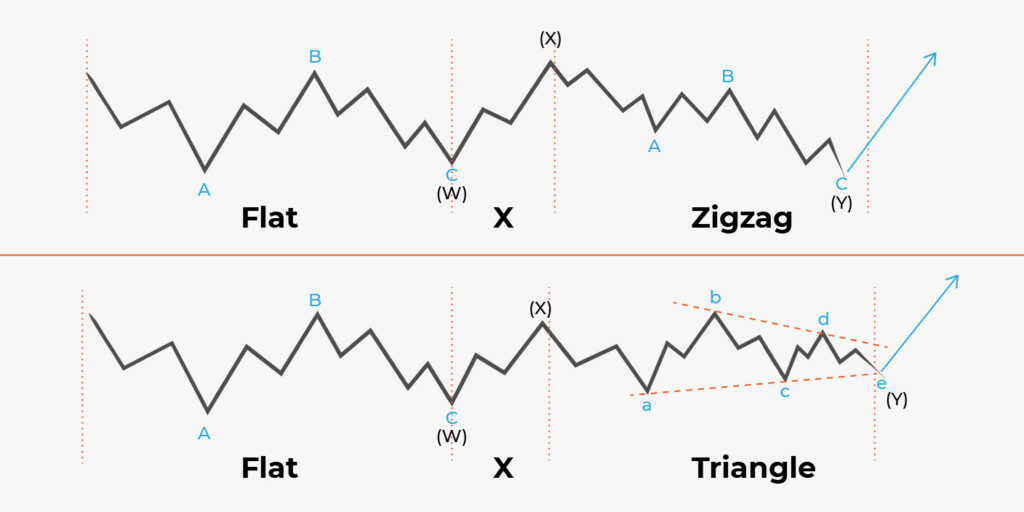
Double three and triple three combo

Double three and triple three combos are the most complex corrections consisting of all the corrections mentioned above. A double three combo is labeled with WXY, and a triple three combo is labeled with WXYXZ. These are sideways ranges composing numerous spikes and wicks. They usually appear in wave 4.
5 of the best scalping indicators to use right away
You can experiment with various indicators, but there are some you can use right away to build your best scalping strategy.
Read more

What types of traders use the Elliott Wave theory?
For the most part, the Elliott Wave theory is used by technical traders. These are the traders that use technical indicators and charts to make a trading decision. The theory is most efficient in the commodity, forex, and stock market, where day traders and long-term investors are active. Thanks to it, traders can identify potential selling and buying opportunities.
What are the advantages and disadvantages of using the Elliott Wave theory?
There are several advantages and disadvantages for traders using the Elliot Wave theory. These can include:
Pros:
· It can be applied to various markets, including forex, stocks, and commodities.
· Since it is leading the price, it may be used to foresee market trends in the future.
· It uses the wave pattern of the market to determine where a selling or buying opportunity may be.
Cons
· It’s an old theory developed in the ‘20s and ‘30s, which means that it hasn’t been updated to take on recent trends.
· There is not much hard evidence to support the theory.
· It relies mostly on interpreting chart patterns, and since many traders have different styles, the results may be subjective.
Elliot Wave theories can be very efficient in helping you come up with a trading decision. However, for better accuracy, you may want to use it in combination with other technical indicators.
What are the key components of the Elliott Wave theory?
The Elliot Wave theory has several key components, including:
· Impulse Waves: Five-wave patterns labeled 1-5 that move in the direction of a trend.
· Fractals: According to the theory, patterns located in larger time frames will repeat in smaller ones and fractals.
· Corrective Waves: Three-wave patterns labeled a, b, and c that move against a trend, often retracing impulse waves.
· Wave Degree: A way of categorizing a specific wave based on its large wave pattern position.
· Fibonacci Ratio: Wave patterns frequently retrace Fibonacci ratios, following the previous wavelength.
Understanding these components is essential for you to come up with a good trading strategy.
How can traders apply the Elliott Wave theory to their trading?
There are several ways in which traders may apply the Elliot Wave theory. The most common methods include:
· Identifying current swings and market trends by using the corrective and impulse wave patterns.
· Setting stop-loss orders to limit potential losses, using corrective waves as a way to anticipate a change in trends.
· Finding divergences between other indicators and wave patterns, indicating a potential trend change.
· Identifying trading opportunities such as selling at an impulse wave end or buying at a corrective wave end.
Several indicators may be used in conjunction with the Elliot Wave theory, such as the moving averages or momentum indicators. This will help you pinpoint buying and selling opportunities.
Takeaway
Elliott Wave theory accuracy is high. However, there is no perfect indicator or pattern. Before the theory provides reliable signals, you should learn all its unique features, practice a lot, and test it in various markets and timeframes.
Sources:
Elliott Wave Theory: How to Understand and Apply It, Investopedia
Elliott Wave Theory: Rules, Guidelines and Basic Structures, elliottwave-forecast.com
Trading with up to 90% profit
<span>Like</span>