
One of the most important components of day trading is developing the ability to recognize technical formations before prices start to move.
Yes, it’s hard to predict the market with 100 percent accuracy; however, if you trade for a while, you’ll start noticing various patterns that could indicate a price shift is about to occur.
Some of the most popular patterns traders adopt to spot trends—continuations or reversals—include cup and handle, head and shoulders, and pennants. In this article, we will discuss the pennant pattern.
Trading with up to 90% profit
Understanding the pennant pattern
A pennant is a sort of continuation pattern used in technical analysis that develops when an asset experiences a major movement, or the flagpole, following a consolidation phase with convergent trend lines (or the pennant) and then a breakout in the same trend as the earlier big movement, or the second quarter of the flagpole.
Pennants have converging patterns throughout their consolidation stage, lasting about one to three weeks. The initial movement must be matched with a huge volume, followed by a significant increase during a breakout. The image below shows what a pennant looks like.
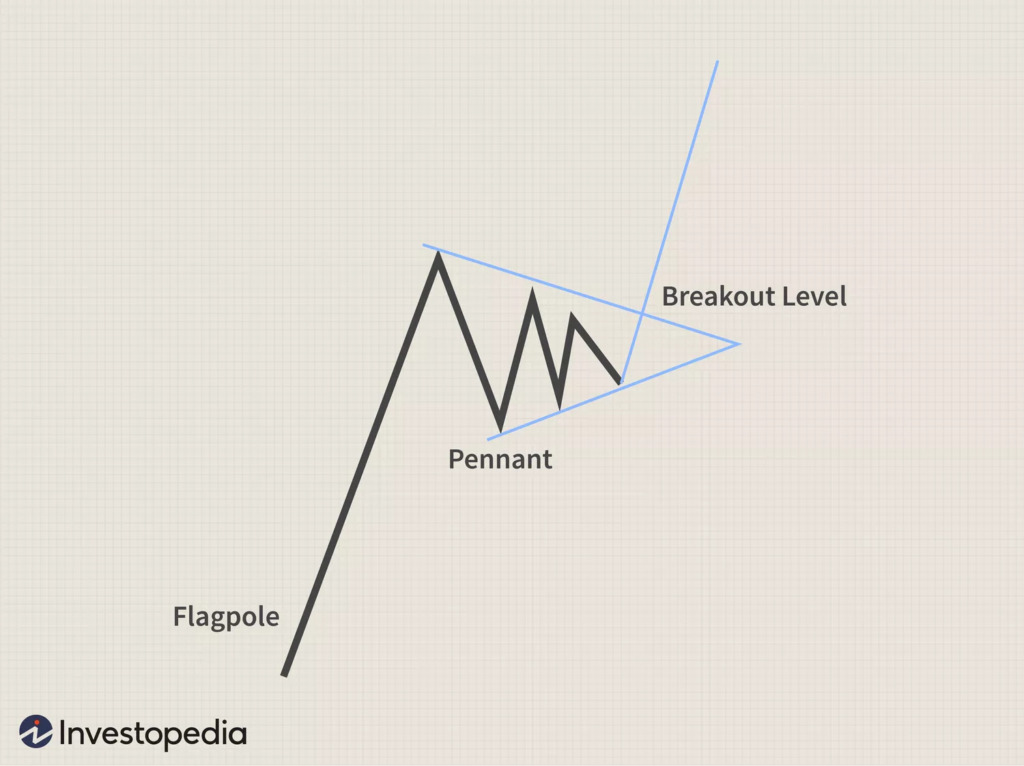
The flagpole in the chart above depicts the preceding upward trend, the pennant pattern formed by the consolidation phase, and the traders’ focus is on the potential breakout of the upper trend line of the symmetric triangle.
Effective strategies in your mailbox
Subscribe and discover a fund of trading knowledge
Great! Please check your email
We’ve sent you an email to confirm your subscription
Something went wrong
Try reloading the page. If that doesn’t help, please try again later
How the pennant pattern works

Traders use pennant patterns to identify potential resumption points for cooling trends.
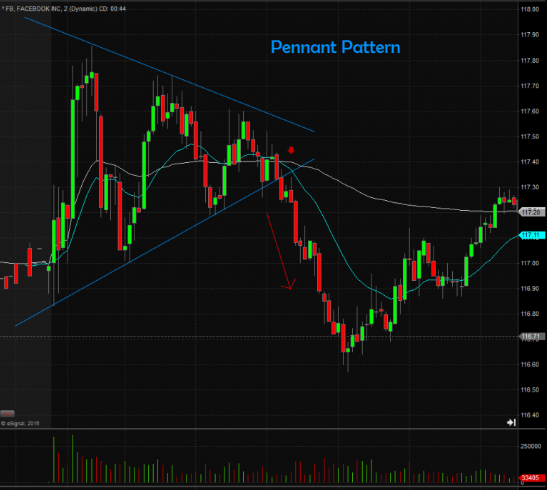
The candles that have a flag-like shape after major movements up or down indicate pennant patterns. The pattern’s flagpole is the first leg up, a period of significant price action in one direction. A consolidation phase, however, can start once the sharp price movement has subsided.
When there is consolidation, it frequently resembles a flag since the stock makes higher lows but lower highs. At the same time, two trend lines appear, one slanting downward to indicate resistance and the other skewing upward to indicate support.
The pennant pattern can be recognized using the V-shaped lines that follow it. These lines seem to converge, indicating that the market is making lower highs and higher lows inside a constantly contracting range.
A breakout occurs when either of these two concurrent trend lines is broken. The breakout frequently involves a lot of volumes, and the price change might be significant. A bearish pattern will be broken when the price breaches the support line and plunges sharply lower.
The trend also resumes in a bullish pennant formation when the resistance line is broken, and the stock starts to move higher. The chart below shows a bearish pennant pattern formed just as the broken support line.
Finding instances of the pennant pattern when they occur is simple, but doing it before they occur is challenging.
The pennant pattern is less frequent in stocks than other technical trading tools, and it is uncommon to come across a neat pennant with a strong flagpole.
However, it’s crucial to pay attention to the pennant pattern. Pennant patterns frequently show significant market moves, which traders can quickly leverage.
Trader’s level test
Answer 7 short questions and define your level as a trader. Take the test now to evaluate your real knowledge!
Start test

Quick tips for using pennant pattern

- Monitor the volume: You can tell you’ve identified a good trade if the expected breakout happens on high volumes. When using technical patterns, pay attention to volume levels at all times.
- If you see a pennant forming, enter the trade cautiously, keeping profit and loss goals in mind. Choose a decent entry point, list your trading objectives, and make sure to exit when your target is met. If the deal goes sour, promptly cut bait.
- Follow the plan: Is there no visible flagpole on your viewing pattern? Is volume declining? The best trade is sometimes the one you DON’T take. Always keep to your plan.
Conclusion
Although one of the most famous technical trading indications is the pennant pattern, this does not mean that every time it appears, traders will automatically benefit.
A pennant pattern is a tool in the enormous toolbox of trading education, just like every other pattern. Never trade solely based on a particular pattern; instead, combine different technical analysis strategies.
Support and resistance, volume, and breakouts are concepts that combine to create effective trading techniques.
Earn profit in 1 minute
+1 <span>Like</span>