Did you know that environmental chef-activists seek to nurture both people and the planet through cuisine, and language teacher-game developers engage learners through gamified experiences? Just as these hybrid professions bring out the best of both worlds, a hybrid trade approach strives to capture the strengths of different trading and investing styles and enhance the overall experience.
Let’s explore this exciting landscape here, and maybe you’ll want to try one on Binomo.
Trading with up to 90% profit
What is a hybrid trading strategy?
A hybrid trading strategy is a versatile approach that combines various trading methods into a single, organized system. Unlike traditional strategies that rely solely on one approach, like studying charts or understanding a company’s financials, a hybrid strategy uses a mix of techniques.
Whether it’s trading or a hybrid investment strategy, here are the several building blocks:
- Momentum trading
- Mean reversion
- Arbitrage
- Quantitative analysis
- Technical analysis
- Fundamental analysis
The main goal of a hybrid strategy is to reduce risk by spreading it across different methods, potentially increasing profits, and adjusting to different market situations.
Effective strategies in your mailbox
Subscribe and discover a fund of trading knowledge
Great! Please check your email
We’ve sent you an email to confirm your subscription
Something went wrong
Try reloading the page. If that doesn’t help, please try again later
Multi-timeframe strategies

Here, instead of only looking at short-term trends, traders also consider the bigger picture from longer timeframes to make more informed choices. First, you analyze the higher timeframe to establish a foundational context for decision-making. As the analysis transitions to lower timeframes, you’ll be able to pinpoint specific trading prospects that align with the perspective you just gained.
Breakout
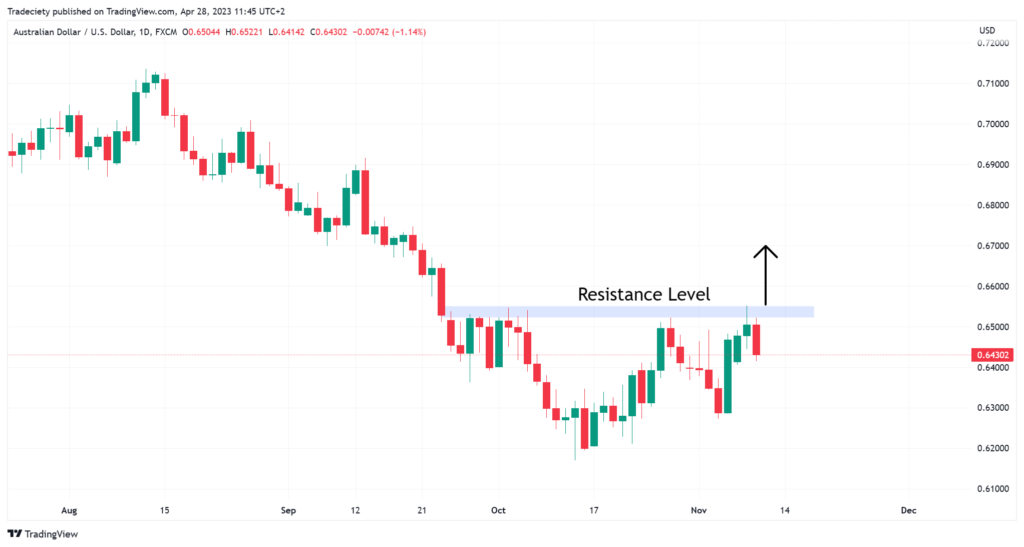
One of the multi-frame strategies is breakout, which uses support and resistance levels from higher timeframes. These levels can lead to either a bounce or a break of a long-term horizontal threshold.
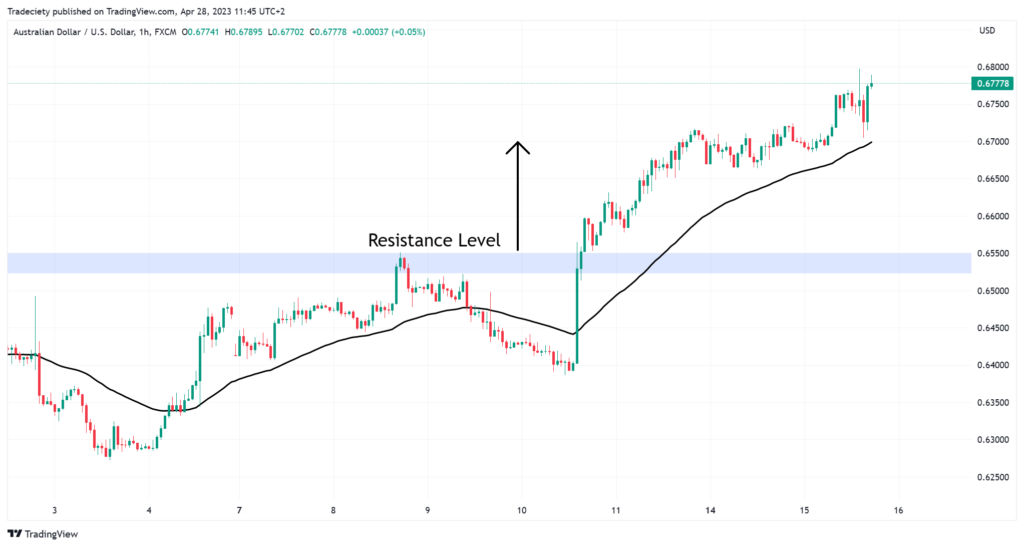
For instance, you identify a resistance level on a daily timeframe and, upon its breach, shift your focus to a lower timeframe to identify potential bullish opportunities. If you see that the market is going up or you get a signal that it’s going to continue going up, consider it a good time to buy. The transition from higher to lower timeframes enhances precision in spotting trends and momentum shifts.
Bounce
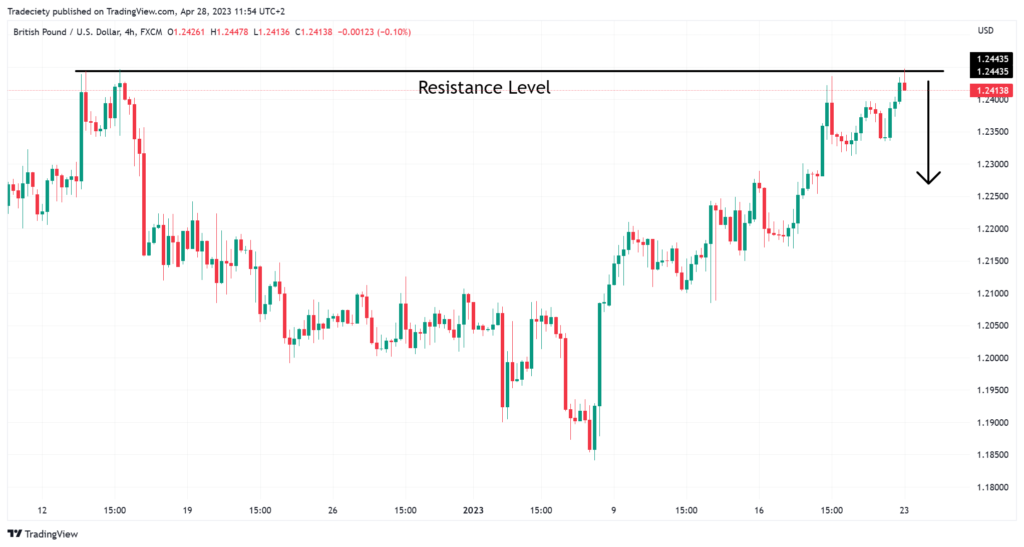
In the case of a bounce strategy, you opt to identify bounces off support or resistance levels instead of seeking a higher timeframe breakout. For example, a higher timeframe resistance level that repeatedly holds serves as a signal. When the price stays below this level, look out for the market direction to turn downward.
If the price stays below the resistance line on a longer timeframe and a pattern forms on a shorter timeframe (indicating a potential price decrease), you might want to think about selling the asset.
Highs and lows
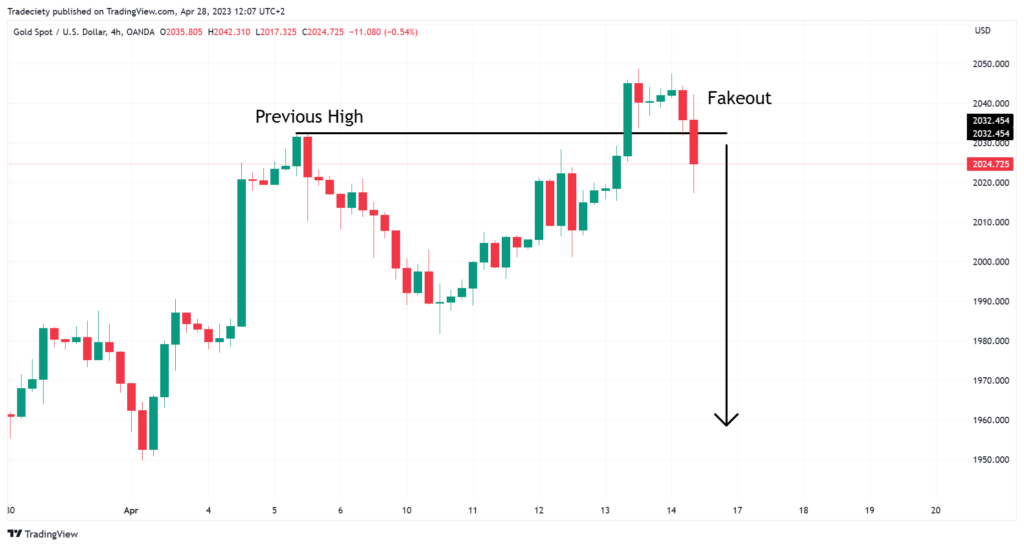
In this method, you look at local highs and lows on a higher timeframe. If a past high (or low) seems strong, it can guide how you feel about the market. This strategy allows you to trade on false breakouts. For example, if the price goes way above the high and then falls below it, this can signal that it might be a false breakout.
Combining this with lower timeframe patterns, like when prices break out of a continuation pattern, e.g. a flag, can help you find the right time to enter a strong downward trend.
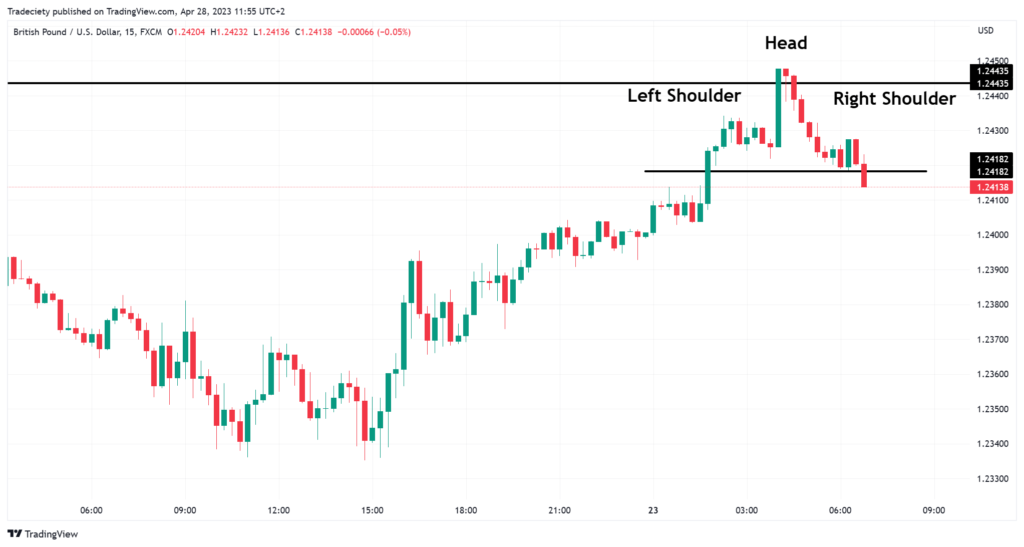
Candlesticks
Candlestick patterns are common in trading, but using multiple timeframes can make them even better. For example, if you see a bullish candlestick pattern on a higher daily timeframe, and the general trend is also up, along with a trend indicator, e.g. a moving average, that’s a strong signal.
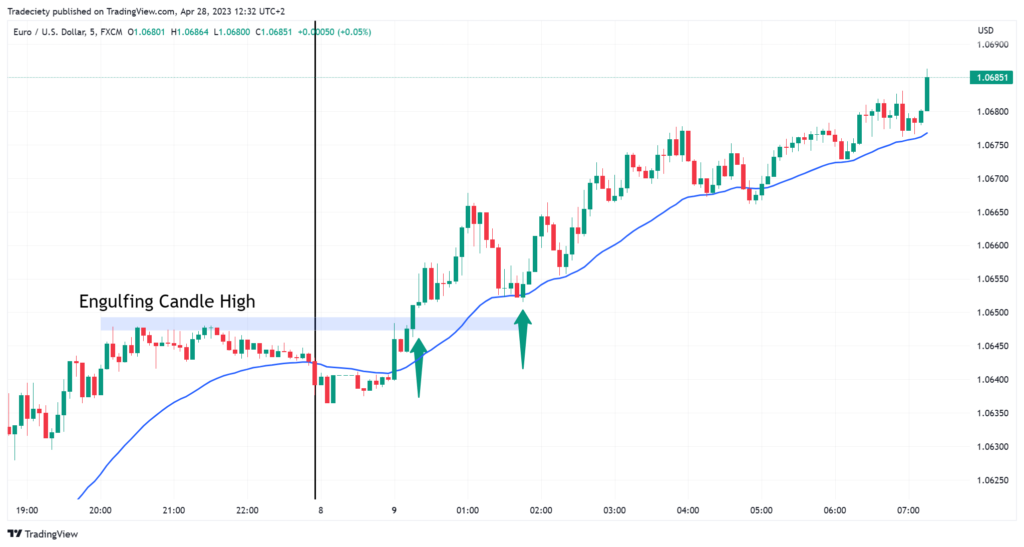

When you switch to a smaller timeframe, you can find an entry point by marking the high of a bullish candlestick pattern and entering a buy trade at its breakout. This can help you take advantage of a longer-term strong bullish trend.
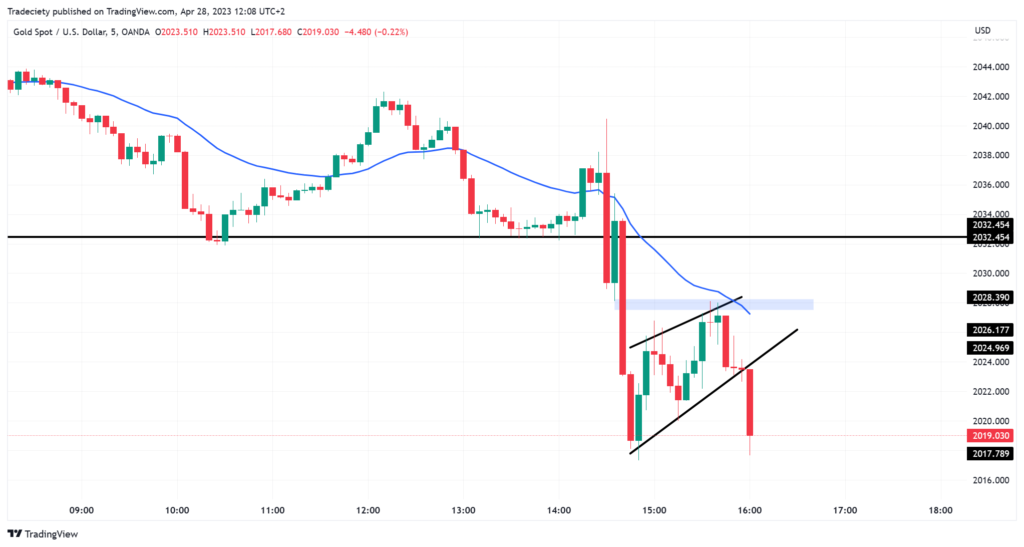
Patterns
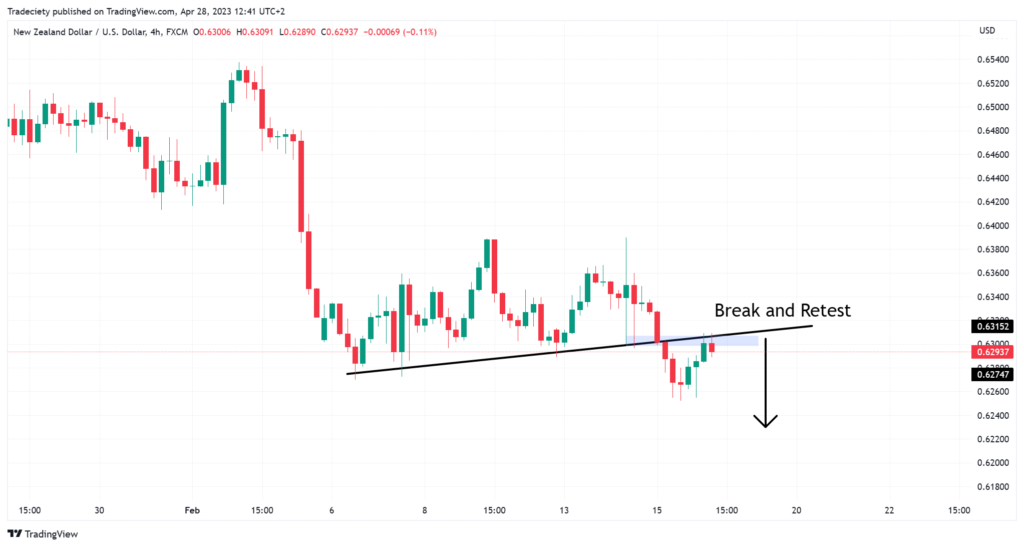
You can also use complex chart patterns to guide your trading decisions on a higher timeframe. For example, if there’s a bearish trend on a higher 4-hour timeframe and you see a pattern that looks like a sideways flag with a trendline, that’s a signal.
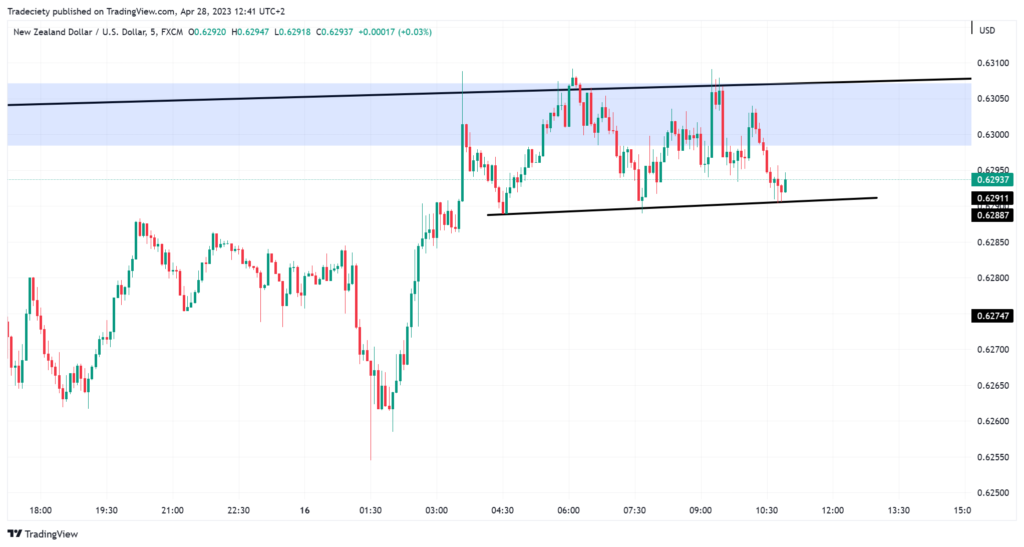
When the price breaks out of this pattern and then goes back to check the trendline, a bearish candlestick signal means things are slowing down. This might be a good time to switch to a smaller timeframe with a potential downward scenario, where patterns like triple tops can help you decide exactly when to enter a sell trade.
Combining different trading techniques
Let’s take an example of blending diverse trading techniques — momentum, mean reversion, intraday trading, and a buy-and-hold stance.
Start from $10, earn to $1000
By allocating an equal weight of 25% to each system, you can harness the unique strengths of each approach. Momentum seeks to ride the waves of trending assets, while mean reversion looks for opportunities in assets deviating from their average value. Intraday trading capitalizes on short-term price movements, and the buy-and-hold strategy provides stability over time.
5 of the best scalping indicators to use right away
You can experiment with various indicators, but there are some you can use right away to build your best scalping strategy.
Read more

Incorporating different types of analyses
Here are a couple of combinations for you to try:
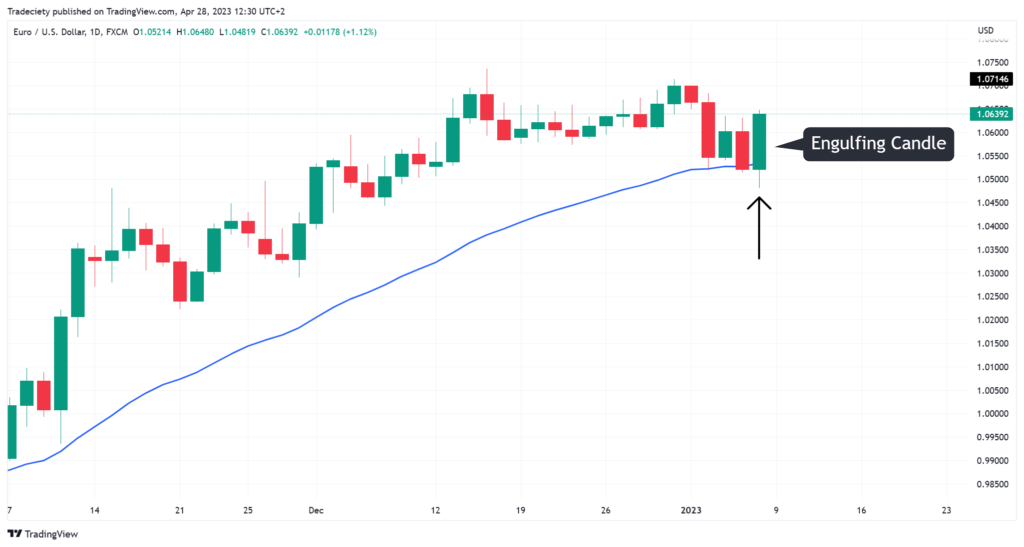
Range-bound trading with fundamental analysis
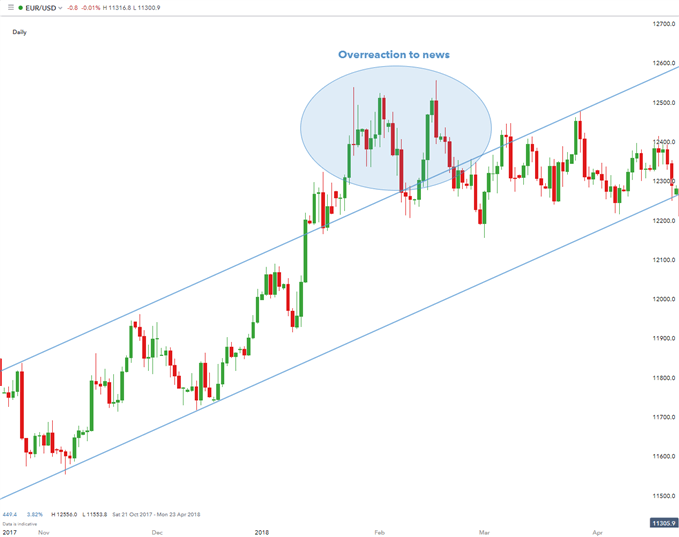
Consider a strong bullish trend in EUR/USD. When the market is trending up, you’ ll look for opportunities to buy at the best possible price.
However, it’s important to consider the impact of news events, which can disrupt range-bound patterns. If news like “NFP” or “consumer price index” figures affect the market, it’s wise to avoid open trades around those times as the price may leave a well-established channel. After such disruptions, prices tend to return to their previous range-bound levels.
Using oscillators with fundamental analysis
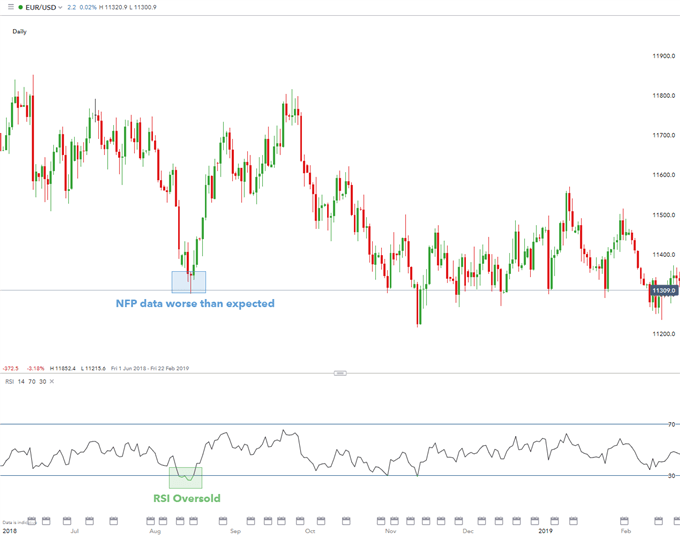
In the image above, you can see the example of using an RSI indicator (a technical tool) in combination with a release of non-farm payroll data, a crucial fundamental indicator in the US.
For example, when the NFP figure falls below estimates, causing the USD to weaken, while the RSI indicator is in the oversold area, this can enhance a decision to buy the EUR/USD pair.
Advantages and disadvantages of hybrid strategies

The benefits of hybrid investing are:
- Diversification of risk — If one strategy doesn’t perform well, the others might make up for it and keep you from taking big losses.
- Adjusting to changing markets —A hybrid strategy is like having different outfits for different weather.
- Steady profits — While individual strategies might have ups and downs, this approach aims to keep your profits steadier over time.
- Possibility of extra gains — You might beat the average and earn more than other strategies.
To illustrate the other side, here are the challenges:
- Complicated — It’s not easy to put different strategies together and make them work well. If you don’t get it right, it could lead to problems or extra risk.
- More costs — Trading in different ways might cost you more due to transaction fees.
- Keeping things in check — A hybrid strategy needs a lot of attention, so you have to check on each part to make sure everything is going as planned.
- Messing with your mind — Switching between strategies could mess with your head and make it hard to stay focused and make good choices, especially when things aren’t going well.
In conclusion, blending different approaches in your analysis is beneficial since you get a more comprehensive view of market trends and potential opportunities.
However, it’s important to acknowledge that different trading styles exist for a reason. Some styles thrive on the precision and focus of specific timeframes, and altering them too drastically might dilute their effectiveness. With trading and investing, it isn’t always a case of “the more, the merrier,” so before making significant trades on Binomo, start with smaller experiments.
Sources:
What is hybrid trading and investing? TrendSpider Learning Center
What is hybrid trading? And is it better for you? BabyPips
Earn profit in 1 minute
<span>Like</span>