An isoquant is a curve that represents different combinations of inputs that yield the same level of output. It is also known as an Iso-productive or Equal Productive Curve. This article provides a comprehensive understanding of the isoquant curve, including its definition, examples, comparison with the indifference curve, its significance in economics, and how it is calculated.
Start from $10, earn to $1000
Definition of an isoquant curve
Before diving into the details of what the curve signifies, let’s first understand the meaning of the term “isoquant. The term is derived from the Greek words “iso” meaning equal and “quant” meaning quantity. In the field of microeconomics, this term holds great importance.
The isoquant curve is a contour line that connects a set of points, representing different combinations of inputs, while keeping the output constant. The curve is plotted on a graph with the X-axis and Y-axis representing different inputs.
Therefore, we can define the Isoquant Curve as a concave-shaped line on a graph that represents all the inputs required to produce a specific level of output. It is used as a measure to determine the influence of inputs, such as capital and labor, on the level of output or production.
Who benefits from the isoquant curve? These curves help companies and large businesses maximize their output while ensuring the availability of necessary inputs. Thus, these graphs provide valuable insights into profit levels.
Effective strategies in your mailbox
Subscribe and discover a fund of trading knowledge
Great! Please check your email
We’ve sent you an email to confirm your subscription
Something went wrong
Try reloading the page. If that doesn’t help, please try again later
Understanding an isoquant curve

Now let’s delve deeper into the formation of the curve. For simplicity, we will focus on the two most crucial factors that affect production or output: capital and labor.
The combination of capital and labor plays a significant role in determining output. Therefore, understanding the impact of increasing or decreasing one factor while maintaining the same output level is the main purpose of the isoquant curve.
The concept of this curve is based on the law of diminishing returns, which is represented by a concave line. According to the law of diminishing returns in economics, there is a limit to the exponential effect of factors on production.
Beyond a certain point, the increase in factors only leads to a marginal increase in production. This ultimately renders further efforts and productivity enhancements futile. Thus, the concave line of the isoquant curve indicates the need to increase labor and decrease capital (or vice versa) to maintain the same level of production.
Note! In an isoquant curve chart, labor is typically measured on the X-axis, while capital is measured on the Y-axis.
Example of the isoquant curve
Let’s illustrate the concept of the isoquant curve with a simple example. Consider the table below, which shows different combinations of labor and capital required to produce a specific output in meters of cloth.
| Labour (L) | Capital (K) | Combination of L&K | Output of Cloth (in metres) |
| 5 | 9 | A | 100 |
| 10 | 6 | B | 100 |
| 15 | 4 | C | 100 |
| 20 | 3 | D | 100 |
The above table shows how the various combinations (A, B, C, and D) of labour (L) and capital (K) help the cloth factory produce 100 metres of cloth. The factory can adjust the levels of L and K based on availability and cost. This flexibility allows the factory to achieve the same output while reducing costs and maximizing profits.
If we plot this data on a graph, we obtain an iso-product curve or isoquant curve. Refer to figure 1 below.
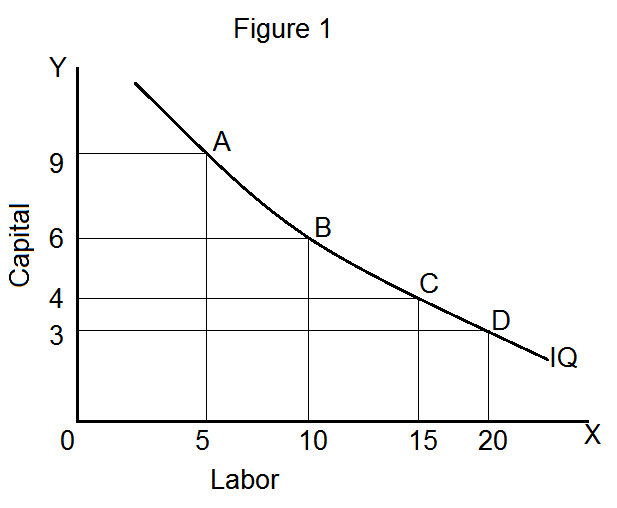
Figure 1 depicts the isoquant curve, which represents all the combinations of labor and capital that can be utilized to produce the same quantity of cloth. In simple terms, the factory can use 9 units of capital and 5 units of labor or move down the curve to combination D, where it uses only 3 units of capital and increases labor to 20 units while maintaining the production of 100 meters of cloth.
Isoquant curve vs. Indifference curve
The isoquant curve and the indifference curve are comparable, although they pertain to different aspects of economics. The isoquant curve illustrates the output generated through the use of labor and capital, while the indifference curve represents the consumption patterns of consumers when comparing two products.
Trading with up to 90% profit
An isoquant curve shows equal output levels, whereas an indifference curve represents equal levels of satisfaction at various points. Refer to Figure 2 (Indifference Map) and Figure 3 (Isoquant Map) below, which clearly demonstrate the different consumption patterns and the corresponding levels of output.
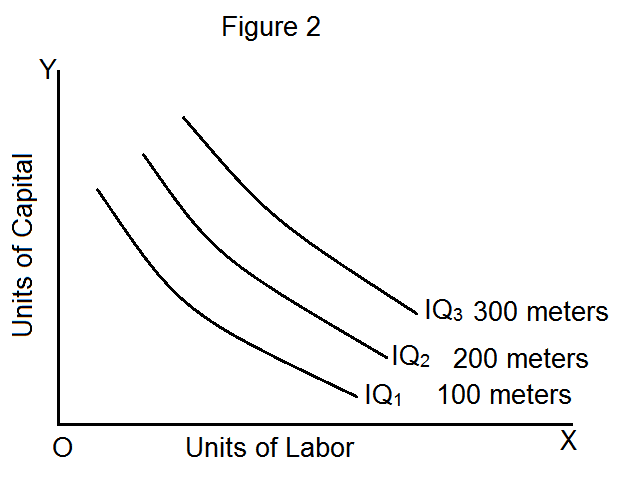
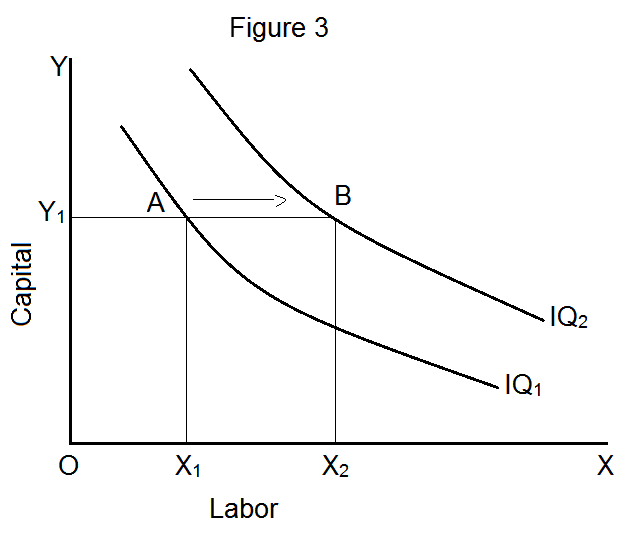
By analyzing the two figures above, we can observe that the isoquant curve focuses on cost reduction through the use of different input values. On the other hand, the indifference curve illustrates the consumer’s consumption pattern between two different goods, reflecting their preferences and demand.
In Figure 2, the indifference curve shows the combinations of two goods that the consumer prefers to purchase. It indicates an equal level of satisfaction and utility derived from different combinations of consumption choices.
The Indifference Curve Example
Let’s take an example to understand when and how an individual stops being indifferent to different combinations of goods. Let’s say there’s a person named Rita who enjoys eating fruits. However, whenever she buys bananas and mangoes, she chooses different combinations each time. This indicates that she doesn’t have a specific preference and is indifferent towards any fixed quantity.
Now, when analyzing this data, an analyst will try to identify the possible reasons behind this variation in quantity. It could be due to factors such as availability, cost, longevity of preference, or even the season. Therefore, the consumer’s consumption or preference pattern can be derived using the indifference curve.
This leads us to the properties of isoquants, which are similar to indifference curves but also have some differences.
Here are two key differences between isoquants and indifference curves:
- The indifference curve represents satisfaction that cannot be measured in physical units, whereas an isoquant can be measured in physical units.
- In an indifference map, a higher indifference curve indicates greater satisfaction, but it doesn’t quantify the magnitude of the increase or decrease. On the other hand, an isoquant curve shows the output change between two curves.
Note! Both curves have a similar sloping shape, but the indifference curve is read as convex, bulging outward from the origin.
Trader’s level test
Answer 7 short questions and define your level as a trader. Take the test now to evaluate your real knowledge!
Start test

Properties of an Isoquant Curve
To analyze an isoquant curve, it’s essential to understand its seven properties. Let’s take a look at each of them:
#1: An isoquant curve slopes downward or has a negative slope.

An isoquant slopes downward from left to right due to the principle of diminishing MRTS (Marginal rate of Technical Substitution). This principle states that a decrease in one input must be compensated by an increase in the other input to maintain a specific output level.
#2: An isoquant curve is convex to its origin due to the MRTS effect.
An isoquant curve always remains convex to its origin. This means that to achieve a specific output level, an increase in capital input will result in a proportionate decrease in labor input, or vice versa. Therefore, one factor substitutes the other proportionately.
#3: Isoquant curves cannot intersect or be tangent to each other.
Similar to indifference curves, isoquants cannot intersect or cut each other. Such an intersection would yield invalid results. In simpler terms, the same combination of capital and labor inputs cannot produce two different outputs.
#4: Isoquant curves in the upper portions of the chart yield higher outputs.
Isoquants located at higher levels on the chart indicate that the input level of either capital or labor is greater compared to isoquants at lower levels. For example, between IQ1 and IQ, there will be a difference in the quantity of labor or capital inputs because IQ1 generates more output than IQ.
#5: An isoquant curve should not touch the X or Y axis on the graph.
In the production process, both capital and labor inputs are necessary to generate an output. If an isoquant curve touches either the X or Y axis, it would imply that one of the inputs (either labor or capital) is zero, which is impossible. This violates the basic principle that both inputs need to be present in proportion to generate the desired output.
#6: Isoquant curves do not have to be parallel to each other.
The shape of an isoquant curve depends on the MRTS. Since the substitution rate between labor and capital can vary in different isoquant schedules, the curves do not have to be parallel to each other.
#7: Isoquant curves are oval-shaped.
The isoquant curve represents the efficiency of using inputs. Its oval shape allows firms to identify the production efficiency by using an optimal mix of capital and labor inputs.
What is an Isoquant Curve in Economics?
In economics, an isoquant curve is a graphical representation that shows different combinations of two factors required to produce a given output. By varying the use of capital and labor, the cost-effectiveness of the production process can be determined. This analysis helps firms maximize their profits.
What is an isoquant and its properties?
An isoquant is a graphical representation that shows how different combinations of labor and capital can be used to produce a specific amount of output. It is depicted as a concave-shaped curve, and it helps firms determine the optimal allocation of labor and capital to minimize costs while maintaining a fixed level of output.
Here are some key properties of an isoquant:
- The slope of the curve moves from left to right and decreases.
- On a graph, higher levels of output are represented by isoquants that are located towards the right and higher up.
- Isoquants do not intersect with each other.
- The curve is convex to its origin, forming an oval shape.
- The shape of the curve assists in decision-making processes.
What is isoquant and isocost?
While an isoquant represents output, an isocost represents the cost of production. By combining isoquants and isocosts on a graph, firms can determine the most efficient combination of input factors to achieve maximum output at minimum cost. Isoquants show different combinations of factors that yield the desired output, while isocosts show the combinations of factors that result in different costs.
How to calculate isoquant?
A graph showing the combination of capital and labour inputs to generate an equal amount of output is what an isoquant graph is all about. Isoquant uses the formula of MRTS. Since the slope of an isoquant is moving down, it is represented in negative.
MRTS (L, K) = – ΔK/ΔL = MPL/MPK
where:
K – Capital
L – Labor
MP – Marginal Products of inputs
ΔK/ΔL – Amount of capital that can be reduced when labour is increased.
The graphical representation calculates MRTS at any given output level as dL/dK.
What is the slope of an isoquant?
The concave curve, known as the isoquant curve, represents the relationship between capital and labour to produce a defined output value. The slope of this curve is based on the principle of MRTS, which means the marginal rate of technical substitution. Thus, the slope represents the change in one factor with a reciprocal and proportional change in the other.
The bottom line
In summary, the isoquant curve provides a graphical representation of the combination of capital and labor required to produce a given level of output. By analyzing the slope of the curve, firms can determine the optimal allocation of inputs to achieve cost-effective production. However, it is important to consider other factors such as indifference curves, isocosts, and market conditions to make informed decisions and avoid potential risks to profitability.
Earn profit in 1 minute
<span>Like</span>