
Did you know that you could “predict” market reversals and boost your trading percentage by properly timing your entries? There is a good reason why channels are a common trading indicator. A trader who understands the proper use of channels can add a fantastic tool to discover extra confluence variables for their price analysis.
It’s easy to use a technical indication like the Keltner channel. This indicator, which is based on volatility, has three different lines. A price’s exponential moving average (EMA) is in the middle. The lower and upper bands are set at twice the average true range. These bands also grow and shrink as the volatility (as measured by ATR) does. Oversold and overbought levels can be distinguished using the lower and upper bands.
This indicator helps you better time your market entries and can also help you take better trades. Keep reading to learn all you need to use the Keltner Channel strategy in trading.
Earn profit in 1 minute
What is a keltner channel?
The Keltner Channel is a volatility-based band used in determining a trend’s direction and is placed on both sides of the price of an asset. It was developed and introduced in the 1960s by Chester Keltner, who termed it after his name. Simple Moving Averages (SMA) and upper and lower price ranges were used in the original formula to calculate the bands. Over the years, it was modified, and in 1980, another formula that used Average True Range (ATR) emerged. This ATR is still in use to date.
Effective strategies in your mailbox
Subscribe and discover a fund of trading knowledge
Great! Please check your email
We’ve sent you an email to confirm your subscription
Something went wrong
Try reloading the page. If that doesn’t help, please try again later
Keltner channel formula

Keltner Channel’s default setting calculation:
- Keltner Middle line: 20-period EMA
- Keltner Upper line: 20 EMA + 2 x ATR
- Keltner Lower line: 20 EMA – 2 x ATR
The middle line can be regarded as the average, and the lower and upper bands indicate how distant the price is from the average.
How to use keltner channel strategy in trading
As we previously explained, the Keltner channel strategy is a technical indicator that aids traders in determining market volatility, evaluating the current trend, and identifying future breakouts. The middle, upper and lower lines, which constitute the dynamic channel that contains the price point inside the two boundaries, will be displayed when the channel indicator is plotted on the price chart.
Trading with up to 90% profit
Let’s now examine how you can read the Keltner indicator appropriately.
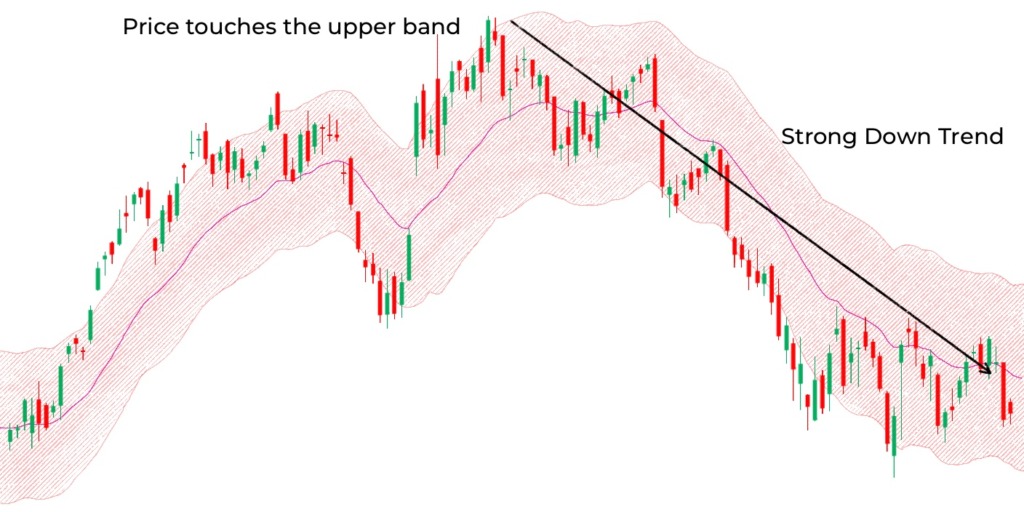
You can see from the figure below that a strong indication of a downtrend is given when the price hits the upper band, and the upper line likewise points upward.
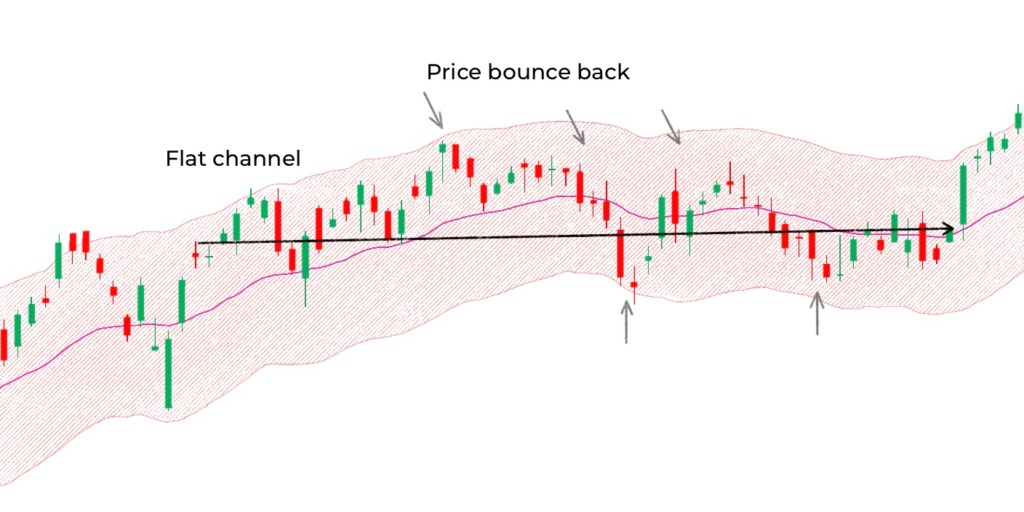
The stock price will typically oscillate between both the lower and upper bands when the price is moving sideways, and the Keltners are flat and moving horizontally.
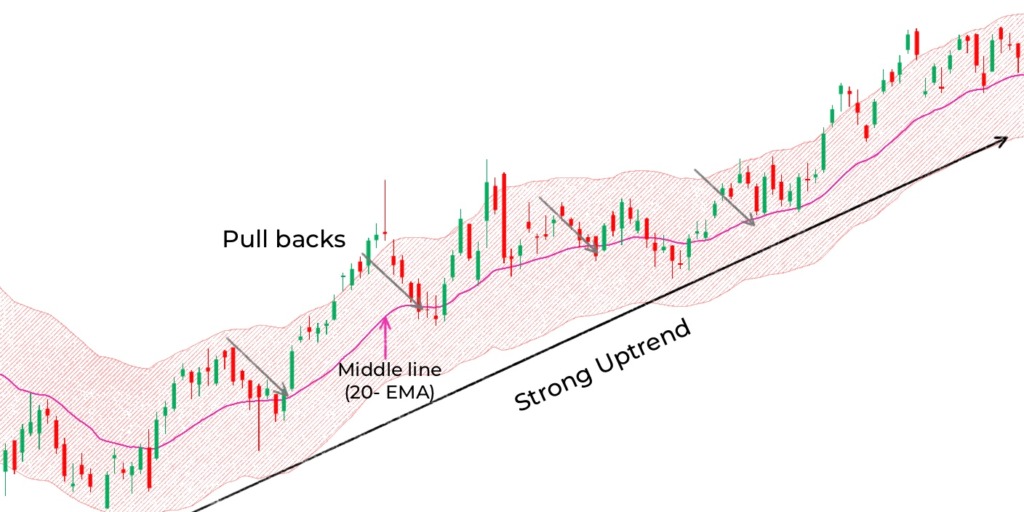
The Keltner also helps in spotting pullbacks. Using this indicator to measure price retracement is usually advisable for traders.
You can observe from the chart below that the price seems to fluctuate close to the midline (20-EMA) when there is a significant upward trend.
Cryptocurrencies: what to expect in 2023
2023 is expected to be the year of recovery for the crypto market. Read on to see what to expect in 2023 for cryptocurrencies.
Read more

Keltner channel trading strategy
The Keltner channel is an extremely potent predictor of breakouts, as we have stated. The best performance of this indicator occurs as volatility increases.
The ADX indicator will be used as the second tool in this Keltner channel technique to obtain more precise results.
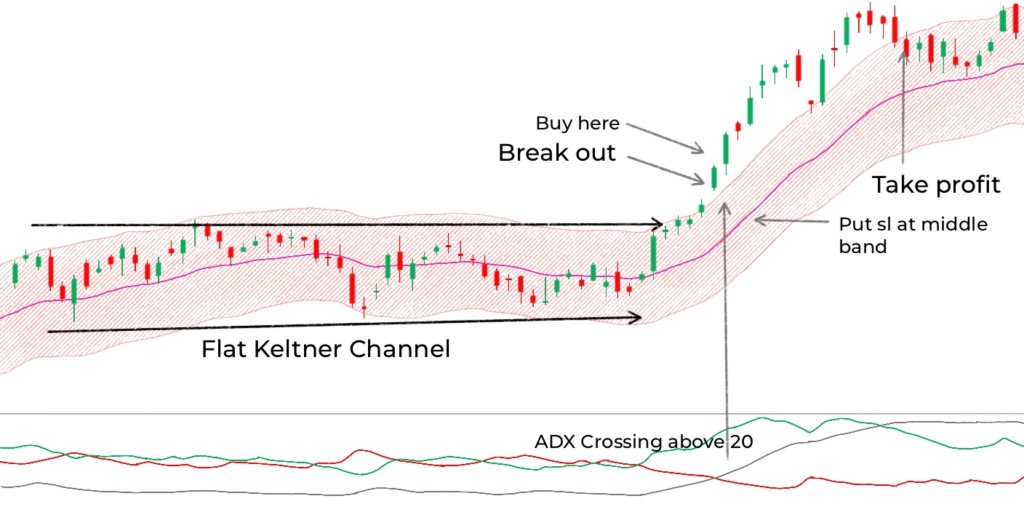
Things to note about this strategy include:
- The ADX indicator is useful for assessing breakout strength.
- A bullish or bearish trend is signalled when the ADX reaches the 20-level threshold.
- Flat Keltner Channel bands are required.
- For a buy order, the price must move beyond the upper band.
- ADX should rise above level 20.
- Price must exceed the lower band for the sell-side, and ADX must drop to below 20 levels.
How do Keltner Channels work?
Keltner Channels, like Donchian Channels and Bollinger Bands, are indicators meant to determine which asset is being overbought, and which one is oversold. The main point of these price channels is to determine where exactly this security will likely trade.

When placed on either side of the price of an asset, Keltner Channels will help determine the trend direction. For the most part, they have an exponential moving average (EMA) of 20 periods, but that can be adjusted based on strategy and preferences. A longer EMA can cause the indicator to lag but can offer a better trend direction. A shorter EMA will offer faster signals, but the trend direction may be more difficult to determine.
Keltner Channels have various uses, and the way they work will depend largely on the settings chosen. You must choose your EMA based on your trading style. While the Keltner Channel will always adapt to the security direction, the volatility can cause it to overextend. This is why you may want to use it together with other indicators.
Interpreting extreme readings
Sometimes, the market can enter an overbought or oversold state. What it does once it enters that stage can be difficult to predict. In some markets, the stock may tend to revert to its mean form. That being said, in other markets, it will merely follow the trend. Depending on the market and timeframe, it could easily mean different things.
For instance, let’s say that you have a mean revision trading strategy, and your Keltner Channels work very well when you set them on a daily timeframe. However, if you switch your timeframe to 5 minutes, there is a good chance that your entire strategy will fall apart.
Different readings can also apply when you are following a different market. Usually, if the price remains close to an extreme line, it signifies trend acceleration. You need to look at the direction of the channel to see if it’s going down, up, or sideways.
Keltner Channel vs. Bollinger Bands
Keltner Channels and Bollinger Bands are quite similar, but their execution is different. The Keltner Channel uses the average true range (ATR) to calculate the lower and upper bands. On the other hand, Bollinger Bands use standard deviation.
Indicator interpretation is similar. Since both use different formulas, there may be differences in the trade signals. Some may say that Keltner Channels are easier to determine as compared to Bollinger Bands.
Keltner Channel in trend following
When Keltner Channels are used in trend-following strategies, the lower and the upper bands of the channel function as a breakout level. If you see the market closing over your upper Keltner band, it tells you that the market is now in an upward phase.
That being said, the market could also break the lower band on your graphs. If that happens, it means that you can expect a downtrend soon. Depending on your previous readings, you may want to decide on closing your trade at this point.
How to spot explosive breakouts using keltner channel

You might not be aware of this, but…
Market volatility changes in cycles, going through times of low volatility followed by times of high volatility.
This indicates that the least volatile period of the market is the optimum time to accomplish it.
You might be curious…
“But how can I determine when price volatility is at a minimum?”
There are numerous approaches, but one is to use the Keltner Channel.
How to do it is as follows:
- Allow the price to approach the Resistance and Support levels.
- Keep an eye out for a Keltner Channel Squeeze, where the price becomes “trapped” between the outside and middle channel lines.
- On the breakout, enter
Now…
The outside channel line is “near to flat” to imply uncertainty and minimal market volatility during the Keltner Channel Squeeze.
There is probably no Keltner Channel Squeeze present if the outside channel line is steep.
Conclusion
The Bollinger indicator and the Keltner channel are similar. Although both indicators have an upper, middle, and lower band and are envelope-based, their calculations are different.
There are strong prospects of a trend reversal when the price closes near the edge of the lower or upper channel. A hint that the price will shortly break out is indicated when the Keltner channel advances in a flat direction.
Start from $10, earn to $1000
<span>Like</span>