The Marubozu candlestick pattern has been around since the 18th century. It originated in Japan, where traders used this pattern along with others to gauge market trends. However, in this complex world of trading, the Marubozu pattern stands out due to its unique insights.
Start from $10, earn to $1000
What is the Marubozu candlestick pattern?
The Marubozu candlestick pattern is relatively easy to spot. Marubozu means “close-cropped” in Japanese, and this candle on the chart doesn’t cast a shadow. The shadow is also sometimes referred to as a wick, and it can be both at the top of the candle and at the bottom.
Marubozu is a single-candle pattern, which makes it easy to discern amongst others. The lack of a shadow implies that the price did not deviate from the opening-day price range. On days when the closing price is lower than the day’s opening price, it indicates that the trend is turning bearish. Similarly, when the closing price is higher, it means a bullish trend.
Effective strategies in your mailbox
Subscribe and discover a fund of trading knowledge
Great! Please check your email
We’ve sent you an email to confirm your subscription
Something went wrong
Try reloading the page. If that doesn’t help, please try again later
Characteristics of a Marubozu pattern
There are 3 types of Marubozu candles: Open, Close, and Full. In all these cases, the candle has bullish and bearish versions.
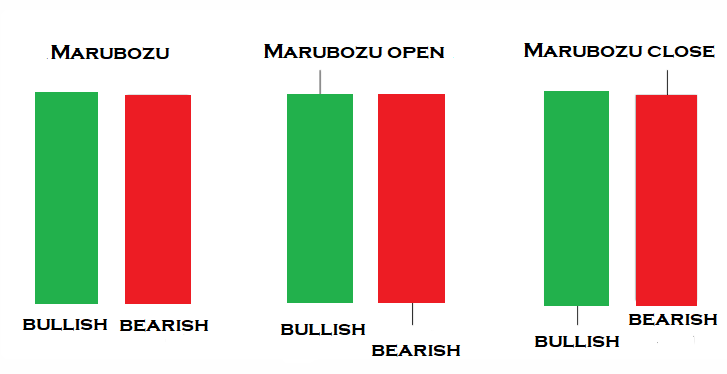
A Marubozu candlestick pattern means that at least one of the open or close values is flat. In the full version, both open and close are flat, i.e., the asset opens a session, starts rising in a particular direction, and closes exactly at the end. It turns out that the open and close prices coincide with the high and low prices.

The opening price for the Marubozu Open candle must be flat. The price action should move only in one direction, and the closing price can slightly differ from the high/low.
The close for the Marubozu Close candle should be flat, while the price action can slightly move in the other direction before it starts aggressively trading in one direction.
Ideally, a Marubozu candle would have no shadows. However, you don’t always see a pure or “full” Marubozu candle in the real market. It is often observed that the price casts a shadow in the direction it is moving.
The absence of shadows or wicks on the candlestick is one of the Marubozu pattern’s most distinctive features because of the significance of what it implies. It shows minimal price fluctuation during the day and that the opening or closing price coincided with the day’s high or low. The absence of shadows indicates a highly decisive market, with either the buyers or the sellers entirely in charge.
What does a Marubozu pattern tell you?
A Marubozu candlestick pattern demystifies the general sentiments of the market. When a green bullish Marubozu candle forms, it indicates that the bulls are rapidly buying the asset, causing its price to push steadily upwards. At the close of the day, if the price manages to close at a wickless or shadowless high, the bullish sentiments will continue to dominate for the next few days.
Earn profit in 1 minute
Similarly, when a red bearish Marubozu candle forms, it indicates that the bears are trying to push the price down. If it closes without forming a wick or shadow, the bears are experiencing very little pushback and will continue to profit from pushing the price down for the next few days.
The Marubozu pattern is compelling because it shows the current trend’s direction, allowing you to organize your trading activity according to the prevailing market sentiment.
Cryptocurrencies: what to expect in 2023
2023 is expected to be the year of recovery for the crypto market. Read on to see what to expect in 2023 for cryptocurrencies.
Read more

Trading with the Marubozu candlestick pattern
The Marubozu candle appears quite regularly in charts. To illustrate how you can use it in a real-time trading scenario, let’s look at a BTC/USDT chart.
Bullish Marubozu candle
As we can see from this chart, a bullish Marubozu candle can be observed on 12th January 2023. The wick doesn’t have a shadow below the opening price but a slight shadow above the closing price. The candle is green.
Thus, we can safely conclude it to be bullish. There is a constant price increase in the two days following the Marubozu pattern. There is some choppy action in the following days, after which the price increases even further.
Bearish Marubozu candle
In this second example, we have a bearish Marubozu candle. It casts a shadow below the closing price, and there is no shadow above the opening price, thus fulfilling our pre-requisites of a bearish Marubozu candlestick pattern.
The candle appeared on 3rd March 2023, and as we can see, there was a significant drop in the price of BTC in the following days.
Failed Marubozu Candle
Our third example shows a Marubozu pattern on 4th November 2022. The candle is bullish, with a wick above the closing price. Thus, according to this indication, the price should increase. However, we see a slight price increase the next day, and in the following days, the price falls a little and then wholly plummets.
The purpose of illustrating this example is to remind you that, like all other indicators, the Marubozu candlestick pattern is not infallible.
The bottom line
The Marubozu candlestick pattern is an excellent indicator because it sums up the general sentiments of the market in an easy-to-spot and determined manner, allowing you to trade short-termed trades for only a couple of days and get a profit.
However, the pattern is not foolproof, and it sometimes fails to gauge the trend in the market correctly. Thus, using this indicator in conjunction with others is always wiser. Furthermore, since the Marubozu candlestick pattern only reveals information about the next few days, it won’t help you to take more significant trades over a longer horizon (swing trades, for example).
Trading with up to 90% profit
<span>Like</span>