In this article, we will learn everything there is to know about the ascending triangle pattern, from what it is to the difference between the ascending triangle and the descending triangle. We will also review how to trade the ascending triangle pattern and discover answers to common FAQs.
Start from $10, earn to $1000
What is the ascending triangle pattern?
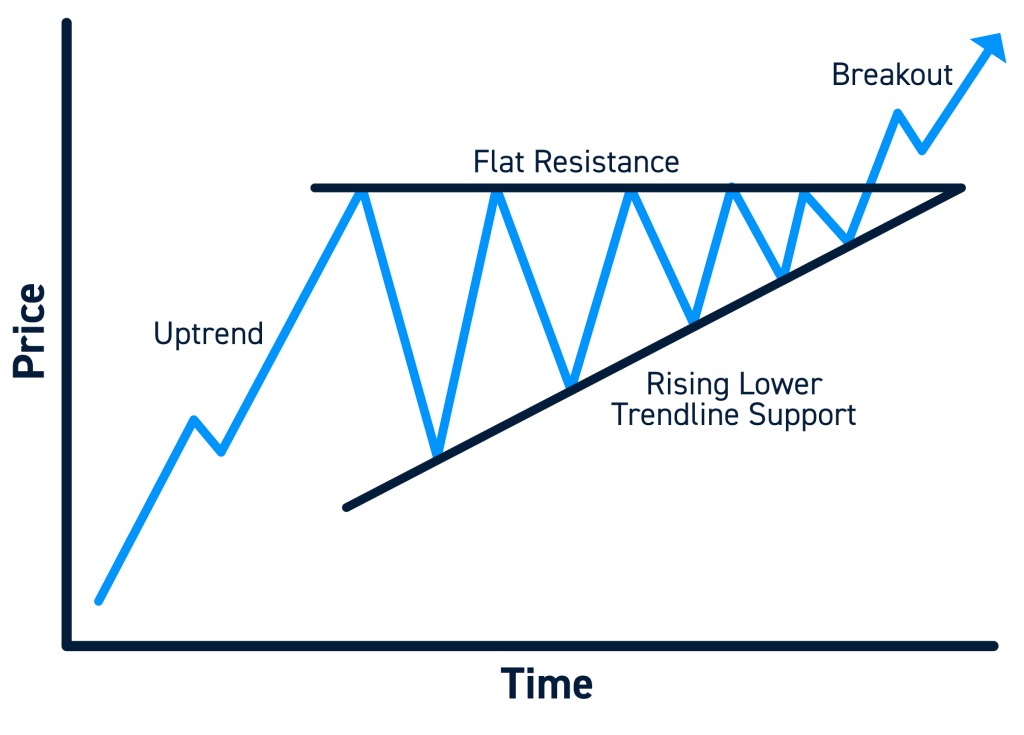
Financial markets employ the ascending triangle pattern as a technical analysis tool to spot potential bullish breakouts in an asset’s price. This pattern develops when a triangle-shaped resistance level appears horizontally and a support level slopes upward.
Many peaks in an asset’s price serve as the resistance level, while a string of higher lows is the support level. Sellers become less likely to sell as the price gets closer to the resistance level, forcing the price to gather steam and form a triangle. Since the ascending triangle pattern shows buyers are growing increasingly aggressive and eager to pay higher costs, it is considered bullish.
Traders may use the ascending triangle pattern to pinpoint extended trade entry opportunities. The breakout must occur accompanied by significant trade activity to prevent deceptive breakouts. Traders should also employ this pattern when combined with other instruments for technical analysis and indicators to support their trading decisions.
Effective strategies in your mailbox
Subscribe and discover a fund of trading knowledge
Great! Please check your email
We’ve sent you an email to confirm your subscription
Something went wrong
Try reloading the page. If that doesn’t help, please try again later
Descending Triangle vs. Ascending Triangle

Technical analysis patterns like the ascending and descending triangle are utilized in the financial markets to predict price moves.
Drawing an upward trendline connecting a minimum of two higher lows and a horizontal resistance level connecting two or more price highs results in the ascending triangle pattern. These lines combine to form a triangle, with the rising trendline serving as the bottom and the horizontal resistance level as the top.
A horizontal support level connecting a minimum of two price bottoms and a downward-sloping trendline linking two or multiple lower highs, on the contrary, constitute the descending triangle pattern. These lines form a triangle, with the horizontal support level as the price’s floor and the sloping downward trendline as its ceiling.
Traders can use both patterns to determine potential trade entry price targets and points. When the price of an ascending triangle pattern breaks over an area of resistance with a lot of trading activity, traders may take a long position and establish their price goals depending on the distance between the resistance level and the base of the triangle.
When a price falls below a support level in a descending triangle pattern, traders may open a short position and establish their price goals based on how far the triangle’s base is from the support level.
Explained: Ascending triangle pattern in a downtrend
Although uncommon, an ascending triangle structure can occasionally occur during a downtrend. Creating a horizontal resistance level that links at least two price peaks and an upward trendline connecting at least two higher lows results in the ascending triangle pattern in a downward trend.
Trading with up to 90% profit
The ascending triangle pattern in a downward trend differs from one in an uptrend because it is bearish instead of bullish. With the resistance as an upper limit and the rising trendline at the bottom, the price action still creates a triangle in this instance, but the overall trend remains down.
Since it indicates that the bulls are turning more aggressive and the bears are less, the ascending triangle pattern in a downward trend can indicate a possible trend reversal. When the price surpasses the rising trendline with significant volume, traders may use this pattern to pinpoint a suitable trade entry point.
It’s vital to understand that compared to an ascending triangle pattern in an uptrend, an ascending triangle pattern in decline is a less dependable indicator. As a result, traders should exercise caution and validate their trading decisions using this pattern in addition to other indicators and methods of technical analysis.
Cryptocurrencies: what to expect in 2023
2023 is expected to be the year of recovery for the crypto market. Read on to see what to expect in 2023 for cryptocurrencies.
Read more

How to trade an ascending triangle pattern?
Trading an ascending triangle includes recognizing the pattern and placing trades based on how the pattern could break. The steps to trade an ascending triangle pattern are as follows:
- Look for a horizontal resistance level that links two or more price rises and an upward trendline that joins two or greater lows to spot the ascending triangle pattern. The ascending trendline serves as the floor of the triangle, with the horizontal resistance serving as its highest point.
- Check the trade volume to verify the pattern, which should rise as the price gets closer to the resistance level. The pattern is confirmed, and a probable bullish advance is indicated by a breakout over the resistance level with a large trading volume.
- Enter when the price exceeds the resistance level with much trading activity. This shows that the bulls are in charge, and pricing may increase further.
Remembering that the ascending triangle pattern should be utilized alongside other technical analysis indicators and strategies to validate trading decisions is crucial.
Ascending triangle trading strategy
Here is a four-step breakdown of the ascending triangle trading strategy:
- Step #1: Identify the pattern formation
This method begins by recognizing the ascending triangle pattern, which comprises a flat resistance level and an ascending support trendline. The support trendline is the floor, and the resistance level is the roof, forming a triangle.
- Step #2: On your chart, apply the RSI for 20 periods
Applying the Relative Strength Index (RSI) to your chart with a 20-period value is the next step. The RSI is an oscillator of momentum that gauges how quickly and dramatically prices move. Traders can use it to spot overbought or oversold market circumstances.
- Step #3: Verify the existence of a bullish trend before the ascending pattern
Determining whether the market is experiencing a positive trend before making a trade based on the ascending triangle pattern is crucial. Analyzing the price movement and the RSI can help with this. A bullish trend is present if the RSI is higher than 50 and the price moves upward.
- Step #4: Enter a trade
The last stage is to enter the trade immediately after the price breaks the flat resistance level after the ascending triangle pattern has been confirmed and a bullish trend is visible.
In a bullish market, the ascending triangle trading technique using the RSI indicator is a great approach to spot prospective trading chances. The RSI assists traders in determining if the market has become overbought or oversold, while the ascending triangle pattern clearly shows the optimistic attitude in the market.
It’s crucial to remember that traders shouldn’t depend exclusively on the RSI indicator and the rising triangle pattern. Other technical analysis tools should support trading choices, including moving averages, trendlines, and chart patterns. Technical analysis is a collection of different instruments. Also, traders should consider fundamental factors like economic news, geopolitical events, and other market-moving factors.
How can the ascending triangle pattern be helpful for traders?

Two essential elements comprise the ascending triangle pattern: an upward-sloping trendline and a horizontal resistance level that serves as support. Here is a thorough description of how traders might benefit from the ascending triangle pattern:
- Identify the pattern
Finding a horizontal resistance level that the price has previously had difficulty breaking through and an ascending trendline connecting the higher lows are required for this.
- Bullish bias
As the price makes higher lows, the ascending triangle pattern signals that purchasing pressure is increasing. This is a bullish indicator. According to the traders’ interpretation of this pattern, the price will likely break out above the resistance level.
- Price targets
Following a breakout, traders estimate price objectives using various techniques. Calculating the triangle pattern’s height (from the lowest low to the horizontal resistance level) and then projecting it upward from the breakout point is a typical strategy. This provides a rough goal for the prospective upward movement. As prospective targets are reached, traders may also consider other significant resistance levels or recent price fluctuations.
- Entry point
Traders usually enter a trade whenever the price rises above the horizontal resistance level. Many see this as evidence that the purchasing pressure has surpassed the selling pressure, heralding a sizable upward movement.
FAQs
Is the ascending triangle pattern bullish?
The ascending triangle pattern is bullish. This is due to the pattern’s occurrence during an uptrend, which indicates that after a brief time of consolidation, the price will keep rising upward. Traders see a price break above the horizontal trendline as a positive indication, suggesting that the uptrend will continue.
Are ascended triangles advantageous?
In a bullish market, ascending triangles may be valuable for traders to spot trading opportunities. The pattern indicates clear entry signs that let traders better manage their trades.
What does an ascending triangle indicate?
A consolidation phase during an upswing, followed by the possibility of the uptrend continuing, is indicated by an ascending triangle pattern. Suggesting that the uptrend will continue, traders see a price break over the horizontal trendline as a positive indication.
When should I enter a trade with an ascending triangle?

Entering a trade on an ascending triangle pattern is a good decision once the price crosses the horizontal trendline. This is because a breakthrough above the horizontal trendline offers a clear entry signal and indicates that the uptrend has to continue.
What are the limitations of the ascending triangle trade?
Although the ascending triangle pattern is a helpful tool for traders, it has some drawbacks. For instance, the pattern may not always be easy to spot, and false breakouts may happen, resulting in losses.
The bottom line
Ascending triangles appear when an asset’s price oscillates within a horizontal upper trendline and an ascending lower trendline. Ascending triangles are sometimes referred to as continuation patterns since the price commonly moves in the same path as the trend before the triangle’s creation. Before entering a trade, traders watch for the price to break above or beneath the pattern. But before taking a position, traders should consider additional technical analysis tools and fundamental variables, as no one trading strategy can ensure a positive result.
Earn profit in 1 minute
<span>Like</span>