Price action, a trading approach that analyzes an asset’s trading behavior, has gained significant importance in the trading community. Traders who employ price action strategies disregard technical indicators and fundamental analysis, instead honing in on an asset’s trading direction and patterns to predict future movements. This comprehensive guide delves into the head and shoulders pattern, a widely recognized price action strategy traders use to identify chart reversals.
Trading with up to 90% profit
What is the Head and Shoulders Pattern?
Traders use the head and shoulders pattern to detect changes in price trends. This pattern shows up when the value of an asset is rising, and it indicates that there may be a new downward trend after it’s done. The pattern has three peaks, with the middle one typically higher than the other two, which gives it the appearance of a human head and shoulders. It is part of a collection of reversal patterns, which include the double or triple top, hammer, bullish and bearish engulfing, doji, and rising and falling wedge patterns.
Effective strategies in your mailbox
Subscribe and discover a fund of trading knowledge
Great! Please check your email
We’ve sent you an email to confirm your subscription
Something went wrong
Try reloading the page. If that doesn’t help, please try again later
Determining Bullish or Bearish Signals
The head and shoulders pattern is usually seen as a bearish signal. This means a previously bullish trend is losing momentum and will soon become bearish. However, if the head and shoulders pattern appears after a bearish trend, it signals a decrease in bearish momentum, which could result in a new bullish trend.

The head and shoulders pattern is commonly interpreted as a sign of a forthcoming bearish trend. This pattern suggests that a previously upward trend is losing momentum and will soon turn downward. However, if the head and shoulders pattern appears after a downward trend, it signals a decrease in the bearish momentum, potentially resulting in a new upward trend.
Formation of the Head and Shoulders Pattern
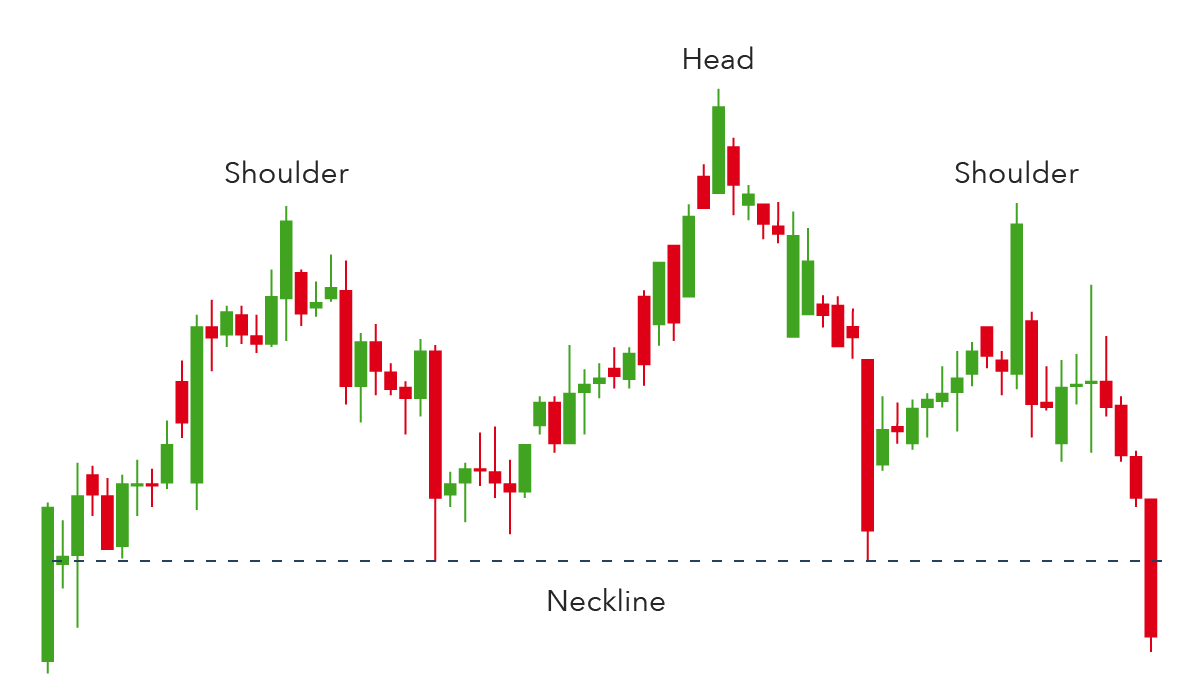
The head and shoulders pattern follows a straightforward formation process. It consists of several key components:
- Previous Trend: The pattern requires an initial upward trend to form; without it, the head and shoulders pattern cannot emerge.
- Left Shoulder: The first peak of the pattern occurs when the price experiences a minor downtrend within the uptrend.
- Head: Following the initial downtrend, the price recovers and rallies, surpassing the level of the left shoulder.
- Right Shoulder: After the formation of the head, the price experiences a decline, followed by another upward trend that reaches the same level as the left shoulder.
- Neckline: The neckline is formed by connecting the lows of the left, head, and right shoulder. It can have an upward, downward, or horizontal slope.
- Volume: Changes in volume play a crucial role in confirming the formation of the head and shoulders pattern.
Note! Completing the pattern requires the price to move below the neckline.
7 golden rules of trading
Everyone has their own trading style, but some principles are critical for success. Make sure you’re following these basic rules of trading.
Read more

Insights from the Head and Shoulders Pattern
Traders can use the head and shoulders pattern to identify a decline in a bullish trend. This pattern shows that the price initially encountered resistance, then dropped to a support level, bounced back above the initial resistance, but struggled to exceed it. The price returned to the support level and encountered another resistance at the same level as the first, indicating a decrease in bullish momentum. On the other hand, the inverse head and shoulders pattern suggests a reduction in bearish momentum.
Start from $10, earn to $1000
The head and shoulders pattern is helpful for traders who want to identify a decline in a bullish trend. This pattern is characterized by a series of price movements that begin with an initial encounter with resistance, followed by a drop to a support level. The price then bounces above the initial resistance but struggles to exceed it. Eventually, the price returns to the support level and encounters another resistance at the same level as the first. This second encounter with resistance indicates a decrease in bullish momentum and may be a sign that the trend is about to reverse. Conversely, the inverse head and shoulders pattern, where the support and resistance levels are flipped, indicates a decrease in bearish momentum and may signal the start of a new bullish trend.
Significance of the Neckline
The neckline plays a vital role in confirming the validity of the head and shoulders pattern. It also helps in determining the potential profit target for the asset. Traders typically estimate the target by measuring the distance between the head and the neckline.
Inverse Head and Shoulders Pattern
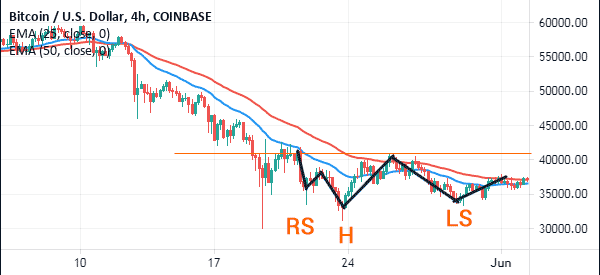

The inverse head and shoulders pattern is the opposite of the head and shoulders pattern. This pattern appears during a downtrend and has the same critical components as the original. In a recent chart, Bitcoin’s price dropped to $30,000, forming the head and two shoulders, thus creating an example of an inverse head and shoulders pattern. While a bullish breakout is still pending, there is potential for an increase in Bitcoin’s price.
Analysis of Head and Shoulders Patterns on Charts
To effectively use the head and shoulders pattern, following specific steps is essential:
- Analyze the chart of the asset being traded and determine the stage it’s in. To identify the left shoulder and head, it’s recommended to use a chart that displays these components.
- Track its movements and draw the neckline. Be patient and wait for the formation of the right shoulder.
- Observe whether the price moves below the neckline and monitor any subsequent drop, which signifies further declines.
Trading platforms provide tools designed specifically for identifying the head and shoulders pattern. Use them to make the right trading decision.
Head and Shoulders Trading Strategy
Traders usually follow a simple process when implementing a trading strategy based on the head and shoulders pattern. First, they place a sell-stop order below the neckline. Then, they calculate the take-profit level by measuring the distance between the head and the neckline. To manage risk, they place a stop-loss order at the right shoulder. This is because it can be challenging to pinpoint the exact location of the right shoulder.
Head and Shoulders Pattern in Stock Trading
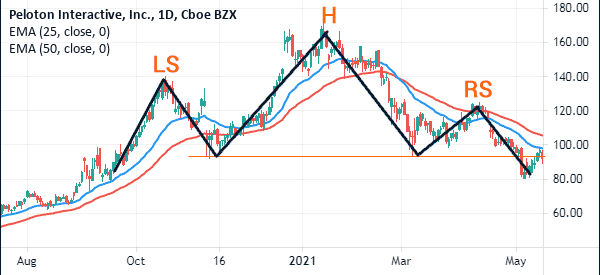
In stock trading, the head and shoulders pattern can be helpful. An illustration of this pattern is evident in the chart of Peloton stock. The stock increased to $140, dropped to $93, hit $170 as the head, and then created the right shoulder at $125. As a result, the stock’s long-term trajectory has the potential for a downward breakout.
The Bottom Line
As a trader, it is essential to recognize the head and shoulders pattern, a well-known chart pattern that can accurately identify potential reversals in price trends. This simple yet effective pattern is favored by many and can be combined with other technical indicators like volume and moving averages to enhance its accuracy. To fully understand this pattern, traders should explore its intricacies, including how to confirm it using volume analysis and which additional indicators can validate trend directions.
By mastering the head and shoulders pattern and combining it with other technical indicators, traders can gain valuable insights into market dynamics. Continual learning and practice can further enhance one’s ability to effectively utilize this widely recognized price action strategy. With this knowledge, traders can make informed decisions in various financial markets.
Earn profit in 1 minute
<span>Like</span>