This article will explore the McGinley Dynamic indicator and discuss its superior features compared to other moving average indicators. We will also delve into the calculation of the McGinley Dynamic and its application in trading.
Trading with up to 90% profit
What is the McGinley Dynamic indicator?
The McGinley Dynamic indicator is an exceptional moving average indicator that outperforms conventional ones. Moving averages (MA) help filter out random price fluctuations and provide an average price of an asset over a specific period. They are valuable for technical analysis. However, the McGinley Dynamic indicator, designed by market technician John R. McGinley, offers enhanced tracking of market movements by adjusting to changes in market speed.
Effective strategies in your mailbox
Subscribe and discover a fund of trading knowledge
Great! Please check your email
We’ve sent you an email to confirm your subscription
Something went wrong
Try reloading the page. If that doesn’t help, please try again later
Understanding the McGinley Dynamic indicator
Common moving average indicators like simple (SMA), weighted (LWMA), and exponential (EMA) depict the average price of a security over fixed time intervals. However, they fail to adjust to changes in market speed, resulting in lag and potential unreliability.
The McGinley Dynamic indicator addresses this issue by considering the pace of market shifts, resulting in a smoother and more reliable moving average. Traditional moving averages can be distorted by market volatility, affecting analysis accuracy. The McGinley Dynamic indicator takes this into account, allowing traders to choose optimal trading strategies.
McGinley Dynamic indicator formula

The McGinley Dynamic indicator formula was published in the Journal of Technical Analysis in 1977. It includes an automatic adjustment factor that speeds up or slows down the indicator in trending markets, solving the problem of changing market speed. While it minimizes lag, it doesn’t eliminate the delay between the moving average trend and the actual price.
Earn profit in 1 minute
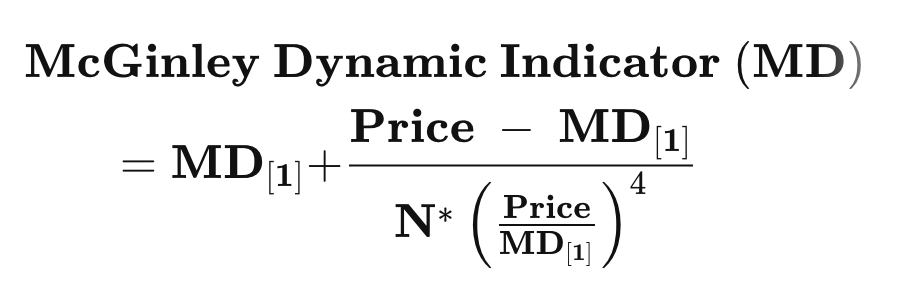
where:
MD[1] = McGinley Dynamic value of the preceding period
Price = Security’s current price
N = Number of periods
You can customize this formula to evaluate trends in different time frames, enabling the monitoring of dynamic price patterns. Incorporating the McGinley Dynamic indicator formula into an Excel sheet eliminates the need for repetitive calculations across various time frames. The indicator’s value can be updated by adjusting the value of “N”.
7 golden rules of trading
Everyone has their own trading style, but some principles are critical for success. Make sure you’re following these basic rules of trading.
Read more

How to use the McGinley Dynamic indicator?
Now that we understand the McGinley Dynamic indicator, let’s explore how to utilize it for better trading decisions. Like other moving average trendlines, this indicator can support the decision to take a short or long position on an asset. Due to its automatic updates in response to market speed changes, a sharp deviation from the trend pattern indicates a potential reversal.
For instance, if the price pattern suggests the price is within a support level range, a trader typically waits for the price to bounce off the McGinley Dynamic moving average before executing a buy order. A stop-loss order is then placed below the support level.
Conversely, if the McGinley Dynamic trendline reaches the resistance level, it’s time to open a sell order. Observing trend directions along with resistance and support levels is crucial for taking positions. Therefore, incorporating different indicators and testing various strategies is essential to optimize technical analysis and confirm trend directions.
Using the McGinley Dynamic indicator for stock screening is a useful tool to identify securities that meet investors’ criteria. Trading platforms like Zerodha offer a wide range of technical indicators, including the McGinley Dynamic, to enhance users’ investment decisions.
Note! Some traders rely on technical stock screeners to identify the best stocks to buy based on indicators like the McGinley Dynamic Indicator.
The bottom line
The McGinley Dynamic indicator is a technical analysis tool that provides moving averages adjusted for market speed. It surpasses traditional moving averages by offering a smoother and more responsive trend analysis of price action.
To learn more about popular technical indicators like the McGinley Dynamic indicator, visit our website.
Start from $10, earn to $1000
<span>Like</span>