

A mean reversion trading strategy is a finance theory that assumes that an asset metric returns to its long-term average value or so-called mean. The metric can be an asset price, price volatility, earnings if talking about shares, indicators, etc. When used in trading, an asset price is what mean reversion traders usually consider. Although the strategy idea is quite simple, it has drawbacks that must be considered in order to make it work.
Start from $10, earn to $1000
What does reversion trading mean?
Interestingly, the mean reversion pattern was identified only in 1985 and for the stock market. Werner de Bondt and Richard Thaler determined that securities and indices return to their longer-term mean values.
Mean reversion trading implies that despite significant fluctuations, an asset price returns to its average levels. To use this approach, a trader should determine the average value of a financial instrument and sell when it rises above the mean and buy when it is below the mean.
However, the strategy highlights no 100% guarantee that the price will return to its average value. Otherwise, it would always move in the same direction.
Effective strategies in your mailbox
Subscribe and discover a fund of trading knowledge
Great! Please check your email
We’ve sent you an email to confirm your subscription
Something went wrong
Try reloading the page. If that doesn’t help, please try again later
How to build a mean reversion trading strategy
There are several challenges when applying the mean reversion trading strategy.
First, a trader needs to determine the price average. A few indicators can help you do this, including the moving average, Bollinger Bands, Keltner channels, and Envelopes.

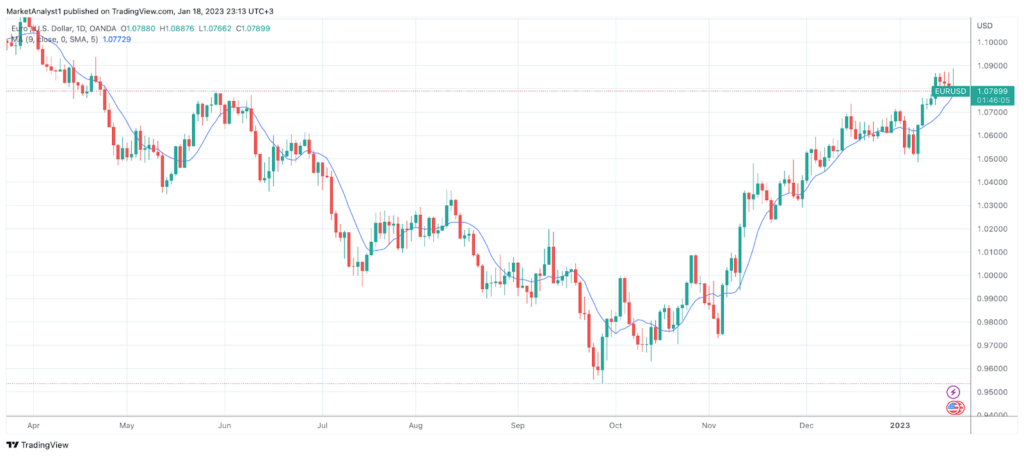
If you implement a simple moving average (SMA) on a price chart, you will notice that the price constantly moves around it, deviating for a period of time. This is because moving averages reflect the average cost for a particular period. Therefore, the SMA can be used as the mean price value. Traders can open trades when the price is far from the moving average and close them as soon as the price touches the SMA.
Another indicator is Bollinger Bands. It consists of three lines, the upper band, the lower band, and the middle line. The middle line can be used as the price average. It’s a common rule that traders sell when the price touches the upper band and buy when it rebounds from the lower band.
Note: It takes time for a price to set an average. Therefore, the strategy doesn’t work on charts with short periods.
The second challenge is identifying whether it’s a new trend or a short-term deviation from the norm, as a new trend always starts with significant price fluctuations. Applying the mean reversion strategy, a trader may wait for the price to turn around, thus, losing an opportunity to enter a new trend at the best levels.
To determine whether it’s a new trend, traders should find fundamental factors that could trigger its formation. If there is no significant news, it’s likely the price will return to its average.
The third challenge is to understand when the price forms a new average. For instance, a domestic currency depreciates when a central bank lowers an interest rate. The monetary policy has a long-term effect, so a new average value will be set.
Mean reversion strategy: example
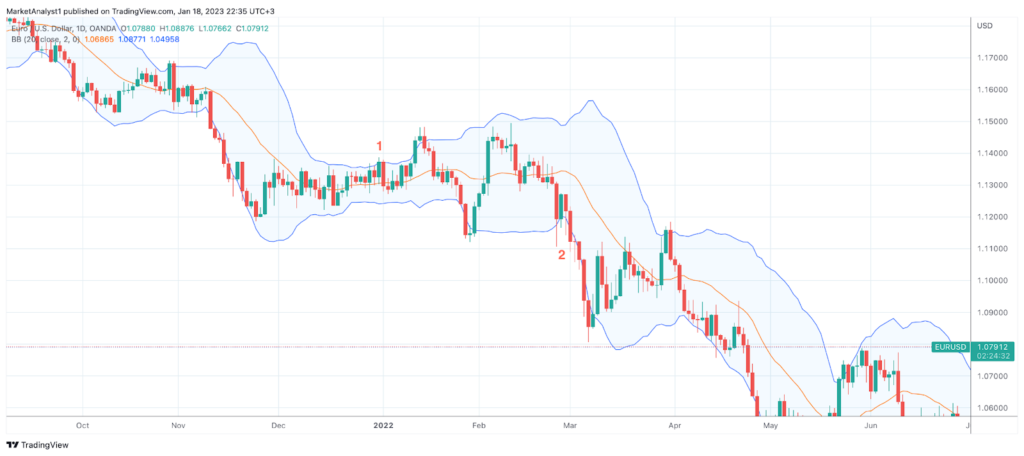
On the chart above, the EUR/USD pair moves within the bands of the Bollinger Bands indicator. Point 1 reflects selling opportunities as the pair has been trading sideways for a while, ensuring a trader the middle line is an average price. However, the price didn’t reverse to its mean but continued moving downwards. To avoid losing early entry, a trader could pay attention to diverging bands that signaled increased price volatility and read the news that could confirm the weakness of the Euro against the US dollar.
Cryptocurrencies: what to expect in 2023
2023 is expected to be the year of recovery for the crypto market. Read on to see what to expect in 2023 for cryptocurrencies.
Read more

Takeaway
The mean reversion strategy doesn’t require complex calculations. Still, it’s a challenging approach that involves lots of practice, time, and patience. Traders should be equipped with numerous technical indicators that can help them determine the average value and confirm the relevance of the strategy.
Sources:
What Is Mean Reversion, and How Do Investors Use It?, Investopedia
Mean Reversion, CFI
Trading with up to 90% profit
<span>Like</span>