

In FTT, or fixed time trading, a trader can calculate potential losses in advance. The idea behind FTT is to forecast an asset’s price direction within a predetermined period, like, for instance, 5 minutes. If the forecast is correct, the trader receives a bonus; if it’s wrong, the trader only loses the initial deposit.
Trend trading is one of the cornerstones of strategies, as it allows traders with little experience to make reliable projections of the future price direction.
Did you know that the possible success rate of trend trading is around 50%?
However, it doesn’t mean that the approach isn’t working. It means some traders avoid learning its unique features and blindly dive into trading. A combination of a trending price and some indicators can provide working signals for FTT traders. Keep reading to learn four strategies that can make trend trading one of your primary instruments.
Trading with up to 90% profit
Moving average
A moving average is one of the major trend indicators. It doesn’t forecast a future trend but confirms it, which makes its signals reliable.
A moving average always follows a trend. If the price moves below it, it’s a bearish trend. Conversely, when the price is above the moving average, the trend is bullish.
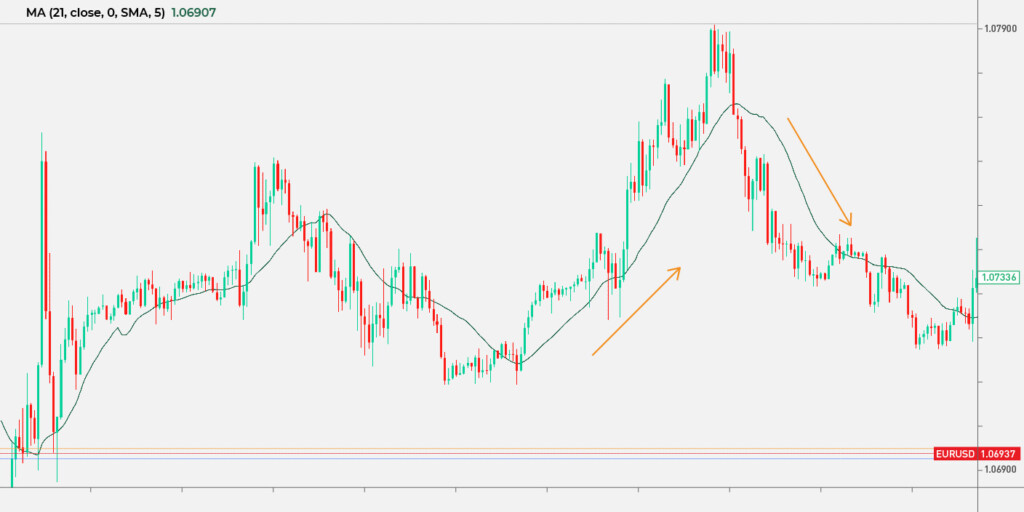
Usually, traders use a simple moving average. Its period depends on the timeframe you trade in. For short-term periods, traders typically use 9- and 21-period SMAs. In higher periods, 50-, 100-, and 200-period SMAs are the most common.
You can enter the market if the price has just crossed the moving average or when the price is already above/below the MA. However, the latter strategy should be used cautiously. An FTT trader predicts the price direction for a certain period. If the prediction is based on the already trending price, there is a risk it will turn around before the trade expires. Therefore, measuring how long the trend is already in force is vital. If the timeframe is low, the trend will last for a limited period. If the timeframe is higher, the trend will last longer.
Effective strategies in your mailbox
Subscribe and discover a fund of trading knowledge
Great! Please check your email
We’ve sent you an email to confirm your subscription
Something went wrong
Try reloading the page. If that doesn’t help, please try again later
Moving average crossovers
Another way to use moving averages for trend trending is to look for a crossover of two moving averages with different periods. Here, traders commonly use SMAs. You may have already heard of golden and death crosses.
A golden cross occurs when the MA with a shorter period breaks above the MA with a longer period, and the price is expected to rise. A death cross is when the MA with a shorter period breaks below the MA with a longer period, and the price is expected to fall.
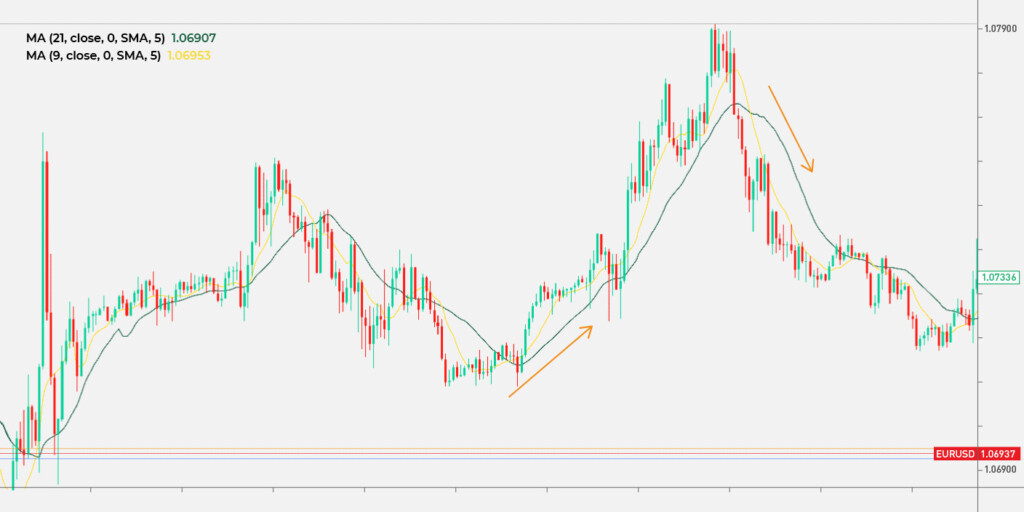
The periods of moving averages you will use can vary. Usually, traders mix 50- and 200-period MAs and 9- and 21-period MAs. However, you can create your own strategy and even combine 9-period and 60-period moving averages, for instance. To avoid mistakes, develop your trading method on a demo account first.
Again, you should be cautious and determine a potential trend length in advance.
Moving averages and the parabolic SAR
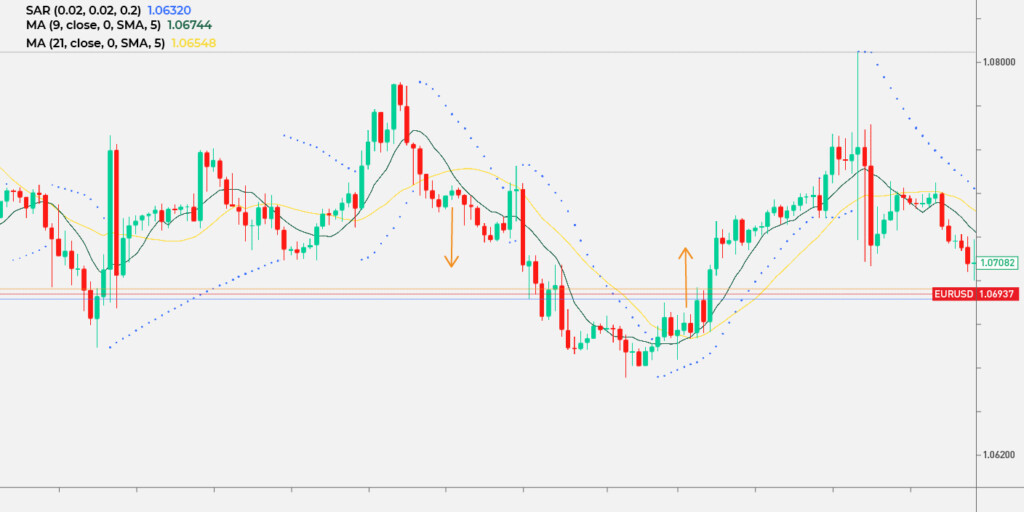
The parabolic SAR indicator reflects the trend direction. However, it’s pretty noisy, meaning its signals constantly change within the overall trend. Here, moving averages smooth its alerts.
Earn profit in 1 minute
Usually, when the parabolic SAR forms at least three dots above the price, the indicator reflects the downward movement. Conversely, when at least three dots of the parabolic SAR appear below the price, it’s a sign of an upward movement.
Then, if there are at least three dots above the price, and MAs have recently formed a death cross signal, you can expect the price to fall. If there are three dots below the price and MAs have recently formed a golden cross signal, you can expect the price to rise.
It’s vital to enter the market not far from a crossover; otherwise, the risks of a price reversal will be too high. Also, this strategy is more effective on higher timeframes due to the significant noise of the parabolic SAR indicator.
5 best coffee types for traders
Coffee is a great beverage for traders. A few daily cups of coffee improves the mind and enables you to make better trading decisions. Check it out!
Read more

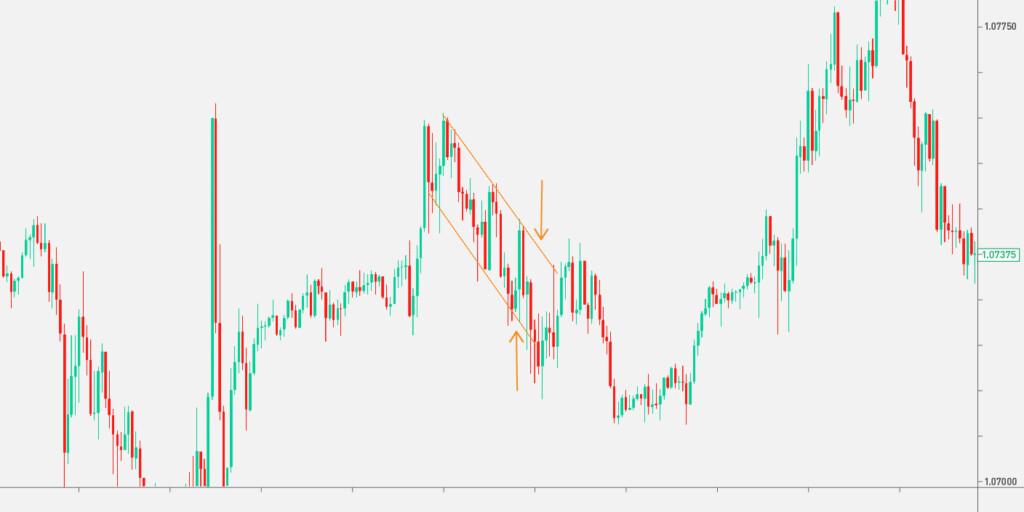
Trendlines
Although a trend can be identified by eye, traders use trendlines to frame it. A trend is confirmed when a trendline connects at least two highs and two lows. Regardless of the trend direction, the rule is: buy at the support level and sell at the resistance level. The profit target will lie at the opposite trendline.

When using this strategy for FTT trading, you should identify the approximate time it will take for the price to reach the target. The time will depend on the timeframe you use and the current price volatility.
Takeaway
One important tip you should use when using the strategies from above is to determine the trade length based on the nearest support/resistance levels. That is, consider how much time it will take for a price to reach the level; it will be the period of your trade.
Trend-following strategies allow traders to place profitable fixed time trades. However, it’s vital to remember that increased volatility can drive the price against the trend for a while. Therefore, it’s better to limit the trend length.
Sources:
Trend Trading: Definition and How Strategy Aims For Profit, Investopedia
What is a Trending Market?, babypips.com
Start from $10, earn to $1000
<span>Like</span>