

Looking at the RSI, you’ll see it’s a versatile indicator for trading, which helps provide vital signals that are useful during a trend. For you to get the RSI crossover signals on the chart when trading, traders need to apply a moving average (MA) to the RSI.
Traders and investors can achieve this quickly by adding an RSI indicator to the chart. On platforms like Freeatockcharts, you can click on the drop-down option beside the RSI to add it to the chart.
Earn profit in 1 minute
Evaluating RSI Settings
The correct RSI standard is usually 14. Although this setting is typically used on daily charts, if a trader is analyzing using a shorter time frame, there is the need to carry out some experimenting.
Check out the guidelines setting:
Effective strategies in your mailbox
Subscribe and discover a fund of trading knowledge
Great! Please check your email
We’ve sent you an email to confirm your subscription
Something went wrong
Try reloading the page. If that doesn’t help, please try again later
Strategy Guidelines for RSI Trend
Applying the RSI crossover indicator must come after a trend is in place. When there is an upward trend, traders are on the lookout for higher swing highs and higher swing lows in the market price. In the case of a downtrend, the reverse is the case.
—Go short
When RSI crossover is applied, traders are usually taken only in the direction of the trend. When there is a downtrend, the RSI is expected to be above 60, indicating a pullback. If the RSI crosses below its moving average, it is advised to go short.
—Upward trend analysis

During an upward trend, the RSI crossover is expected to drop below 40, indicating a pullback. In contrast to the downtrend scenario, traders should go long if the RSI crosses above its moving average.
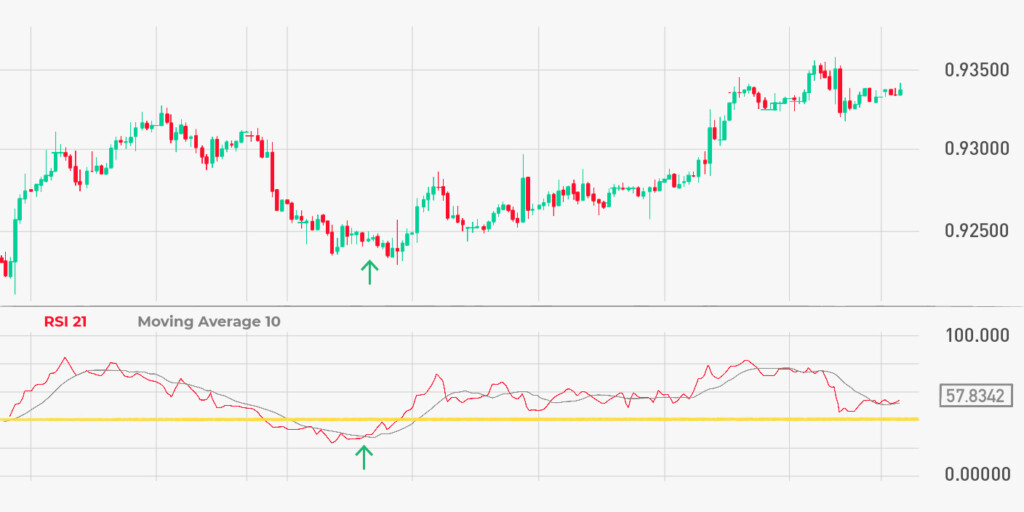
In this chart, there is an uptrend, so the trader only looks for signals that suggest a buy. The RSI crossover is seen to have dropped below 40 (horizontal yellow line on RSI) to indicate to the trader that there is a pullback. The moment the RSI crossover drops below 40, the buy signal is taken to buy a long decision the next time the red line (RSI) crosses the white line (moving average).
—Downward trend analysis
During a downward trend, the RSI crossover is expected to drop further below the trade bar line.
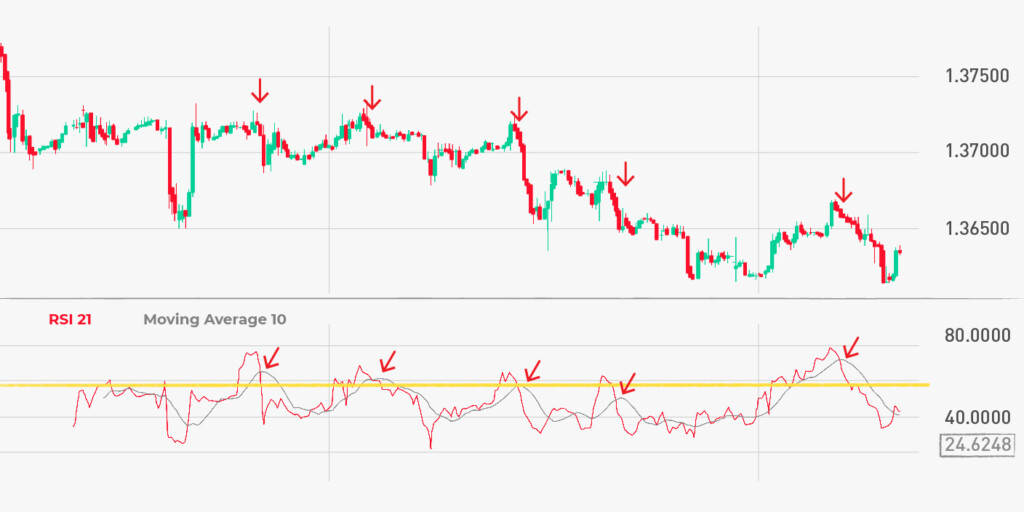
This chart shows the EUR/USD in a downtrend market situation. In this case, only “put” positions are put into consideration. Even if there is a noticeable movement sideways from the left side of the chart to the middle, the total chart trend is down. This means that a sell-short position can still be taken as long as the downtrend is still active on the chart.
—Price bar action
Give the price at least two or three bars (whatever time frame you are trading on) or more before considering an exit. This gives the price some time to move in your favor.

RSI crossover movement: a closer look
When the RSI crossover takes its movement above 60, it calls for a pullback. As soon as the RSI takes direction above the 60 mark (i.e. the yellow horizontal lines), traders are expected to go short when next the RSI red line falls back below the price moving average (white line).
The 40 mark in an uptrend situation and the 60 mark in a downtrend situation act as filters in a trade. Waiting for the RSI crossover to go beyond these levels indicates that the trader is entering amid a pullback that tends towards a more significant trend.
Conclusion: a whole new path
A complete understanding of how the RSI crossover works can help develop a strong entry strategy for traders. As a pro tip, traders should learn to put a stop loss right above the recent high in a short position. In a long position, the trader should put a stop loss below the recent low.
A Fibonacci expansion tool is handy in similar market situations that can be used to locate target prices.
With a title variation in the RSI setting, the market of currency pairs may work better. Once a trend is identified on the chart, you can tinker with the RSI settings to look for what suits the pair, market, and timeframe.
Trading with up to 90% profit
<span>Like</span>