
Trend trading is one of the basic concepts every trader should start with. The market moves in trends. Therefore, if you don’t know how to identify them, you won’t be able to trade successfully.
Two commodity traders, Richard Dennis and Bill Eckhardt, debated over whether an average person can learn to trade. Mr. Eckhardt thought that only a genetically predisposed individual could become a successful trader as trading is an innate skill. Conversely, Mr. Dennis believed that trading is a usual skill that can be learned by anyone. Keep reading to confirm the opinion of Mr. Dennis.
Trading with up to 90% profit
Trend: definition and types
A trend is an overall market direction that lasts for a considerable period of time. There are several categories the trend can be divided into.
1. Direction
When talking about trading and investing in common markets, including stocks, currencies, cryptocurrencies, and commodities, there are two major trend categories: uptrend and downtrend.

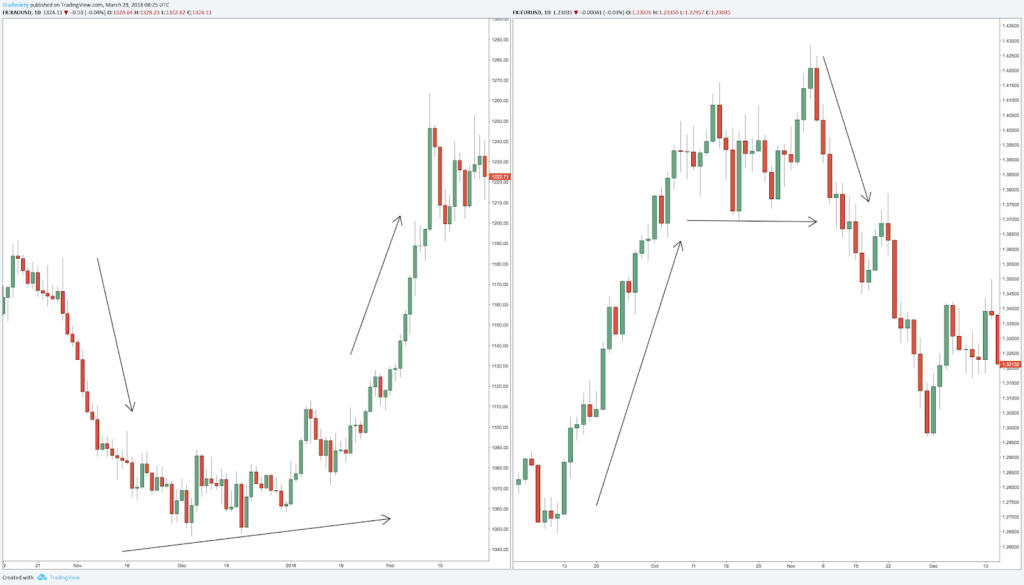
- An uptrend is a situation in which an asset’s price rises, forming higher highs and higher lows. If the pattern of successively higher tops and higher bottoms holds, the uptrend becomes clearly visible on the chart as a line rising from left to right. Trend traders also call it a bullish trend.
- A downtrend is a market condition in which an asset’s price falls, forming lower highs and lower lows. On a chart, it looks like a line descending from left to right. Such price action is also called a bearish trend.
An uptrend or a downtrend doesn’t look like a perfectly straight line. There are always some oscillations; these terms simply help describe the overall direction.
An asset may not be trending upwards or downwards. The term “sideways trend” might be confusing because there is no prevailing trend in either direction. In fact, it means that the market price of an asset price stays relatively the same over the observed period. On the chart, it looks like a flat line (with minor peaks and troughs).
2. Period
The longer the timeframe, the stronger the trend is. Solid trends provide more reliable signals.
- Short-term trend – despite the name, the short-term trend forms from several days to several weeks and occurs on a daily timeframe. At the same time, entry and exit points can be found on intraday charts, and trend confirmations can be determined on longer-term timeframes. Short-term trades are used by swing traders.
- Medium-term trend – it forms from several weeks to a few months. This type is mostly used by position traders. They can use longer-term intervals for analyzing the price direction. Still, entry and exit points are usually determined on daily and weekly charts.
- Long-term trends – a long-term trend usually lasts for several months. It occurs on a monthly chart. However, traders use weekly and daily timeframes to identify entry and exit points. Long-term trend signals are rare. It’s worth mentioning that traders barely use long-term timeframes and trends to hold positions. They are mostly used by investors.
3. Strength
Trend traders need to understand the difference between strong and weak trends and how it manifests on the chart.
For this, you’ll need to learn a simple tool called a trendline. Connect a series of prices across specific swing points on a trend (a minimum of three connection points) to form a sloping line. The trend’s strength is gauged by the angle of the slope: a small angle from the x-axis indicates a strong trend; a big angle indicates a weak trend.
A strong bullish trend is not always a good thing because the asset may be moving up too fast to the point of being overbought. A weak trend is generally more sustainable. A break of a trendline can either mean a decrease in the momentum of a trend or a complete trend reversal.
You can also use trendlines as support and resistance.
Effective strategies in your mailbox
Subscribe and discover a fund of trading knowledge
Great! Please check your email
We’ve sent you an email to confirm your subscription
Something went wrong
Try reloading the page. If that doesn’t help, please try again later
How to trade trends
Most traders identify trends without any tools—they can just determine a trend on the price chart by eye. If you see the price moving in the same direction for a considerable period, it’s a trend. For convenience, frame the trend on the chart using trendlines. Remember that it’s not an automated tool on any trading platform; you’ll need to manually connect highs and lows with the line so that you see the trend direction and its upper and lower bounds.
Some trend traders use technical indicators, with moving averages as the leading tool for indicator-based trend trading. Moving averages are available on all major trading platforms. Now, let’s move on to the core idea of trend trading strategies.
Following a trend
The idea of trend trading is to buy within an uptrend and sell in a downtrend.
Most trend trading strategies are based on the expectation that price movements will continue in the same direction. When a trend reverses (or preferably shortly before), you should close your position.
Catching the right moment
A trend trader wants to catch the trend early.
Every trend, no matter the direction or strength, consists of four stages:
- Young
- Mature
- Aging
- Reversing
There is no point in trading an old trend that will be over soon. It’s much more beneficial to catch trends when they are just forming or when an old trend is about to be replaced with a new one (e.g., a transition from a downtrend uptrend to an uptrend).
Going short
During a downtrend, you can take a short position to profit from a drop.
If you expect the price to fall to lower price points, you can enter a short position to sell the asset for a higher price first and buy it back at a cheaper price later. This trend trading strategy is not as popular as going long.
Different scenarios of trading a trend
There are scenarios on how to trade within a trend: buy on dips in an uptrend, sell on highs in a downtrend; trade on a trend continuation and a trend reversal.

- The first way is to trade within a trend. You can buy when the price touches the lower boundary (support) of the uptrend or sell when it touches an upper boundary (resistance) of a downtrend. However, you should be sure the trend will continue.
- You can open a position in the trend direction on a continuation signal. A strong trend includes periods of correction. The simplest way is to find a continuation chart pattern. You can also use technical indicators that provide signals on a direction; popular trend trading indicators: Parabolic SAR (Stop and Reverse), Moving Average, Bollinger Bands, Relative Strength Index (RSI) and Moving Average Convergence/Divergence (MACD).
- Another option is to trade on trend reversals. It’s the most promising way of trading as it allows traders to enter the market at the early stages of trend formation. Here, you need to use reversal chart patterns and trend indicators that predict a reversal, including RSI, Stochastic, MACD, and Moving Average indicators.
Takeaway
Trend trading provides numerous opportunities for traders. It’s a straightforward approach, which any beginner should master before trying more advanced techniques. That said, you don’t need to adopt a complicated concept over trend trading because it’s been proven effective and consistent in numerous markets. You can reach incredible results by only using the basics—buying when its market trend goes up and selling when it goes down.
Whether you are trading trend-only or following other techniques, you still need to gauge trends to monitor what the markets are doing. Plus, the skills of a trend trader come in handy in different market situations. If you learn how to identify trend corrections, reversals, and continuations correctly, you will increase your chance of successful trades.
The trend is your friend… until it ends. So, in addition to identifying a trend and determining its strength, you should be able to identify reversals – another essential skill in any financial market.
Start from $10, earn to $1000
+1 <span>Like</span>