Understanding technical indicators and finding the best combination can significantly improve your chart reading skills. At the same time, using technical indicators in the wrong way can lead to incorrect signals and unfavorable trading decisions.
We have carefully compiled technical indicators that will provide you with effective trading.
Start from $10, earn to $1000
Why use technical indicators?
Technical indicators help identify current price trends and predict where asset prices might move. Effective technical analysis and trading strategies can boost the sum of possible earnings. However, even though all technical indicators are helpful, each has weaknesses. If you rely on only a single indicator to judge the market, you might miss specific price trends (or danger signs).
Combining several technical indicators to form a single trading strategy can decrease the risks of losing funds. Below, we will discuss how to create the best combinations of technical indicators.
Effective strategies in your mailbox
Subscribe and discover a fund of trading knowledge
Great! Please check your email
We’ve sent you an email to confirm your subscription
Something went wrong
Try reloading the page. If that doesn’t help, please try again later
Types of technical indicators
A strategy utilizing multiple indicators has the risk of becoming redundant because, many times, traders use indicators that provide the same kind of information. To avoid getting trapped in this fallacy, you have to understand that all technical indicators can be categorized into three groups, as follows:
- Trend-Following Indicators allow you to determine whether an asset is oversold or overbought. Many trend-following indicators (for example, the Bollinger Bands) try to create a clear “channel”. It tells you if prices are about to break out or return to normal.
- Momentum Indicators (for example, the Relative Strength Index or RSI) allow you to determine the strength and direction of a current price trend. The more momentum an asset builds, the less risky opening a trade becomes. Using Moving Average indicators can also help you gauge momentum.
- Volume Indicators assist you in identifying the connection between price and volume. Spikes in trading volume almost inevitably lead to an increase in prices. Though, these events do not necessarily always occur at the same time. This is why volume indicators are great tools for advanced predicting. The Money Flow and On Balance Volume (OBV) are two of the most handy volume indicators.
You might notice that while these indicators are categorized in this manner, they are all still trying to predict the same thing: whether prices will decrease, increase or remain stable. Each of them, however, does so from a unique angle. Therefore, using multiple indicators and looking at the market from several angles can give you a more accurate, actionable, and realistic perspective.
Example of how not to use indicators
If you are trading using a multi-indicator strategy that uses MACD, RSI, and Stochastic indicators, you are using three types of technical indicators belonging to the same category. All of them are momentum indicators that will display the same kind of information in one way or another. In the figure above, you can see how all these indicators follow each other together.
So, the problem with using technical indicators of the same kind is that you come to an incorrect conclusion that the trade signals are strong if all these indicators point in the same direction.
The fix to avoiding this problem is quite simple. Avoid using multiple technical indicators from the same category because they all display the same information. The ideal strategy of multiple indicators combines indicators showing different types of information.
The best indicators for trading strategy
Moving ahead, we will highlight the indicators you can use for the best trading strategy. Combine a momentum indicator, a volume indicator, and a trend-following indicator. Each of these complements and supports one other.
Earn profit in 1 minute
RSI (Momentum indicator)
The Relative Strength Index, or RSI, does two jobs. It is a leading indicator and a momentum indicator at the same time. Traders commonly use the RSI indicator because it’s easy to use. It helps identify possibly oversold and overbought conditions in the market.
OBV (Volume indicator)
The second indicator in our strategy is On Balance Volume or OBV. The OBV indicator uses the idea that the activity of the volume and the price are just as important. With this, the OBV combines the price and volume to illustrate the total amount of funds going out of and into the market.
The main concept of the On Balance Volume indicator is based on the fact that the market price will follow the volume flow wherever it goes.
Bollinger Bands (Trend-following indicator)
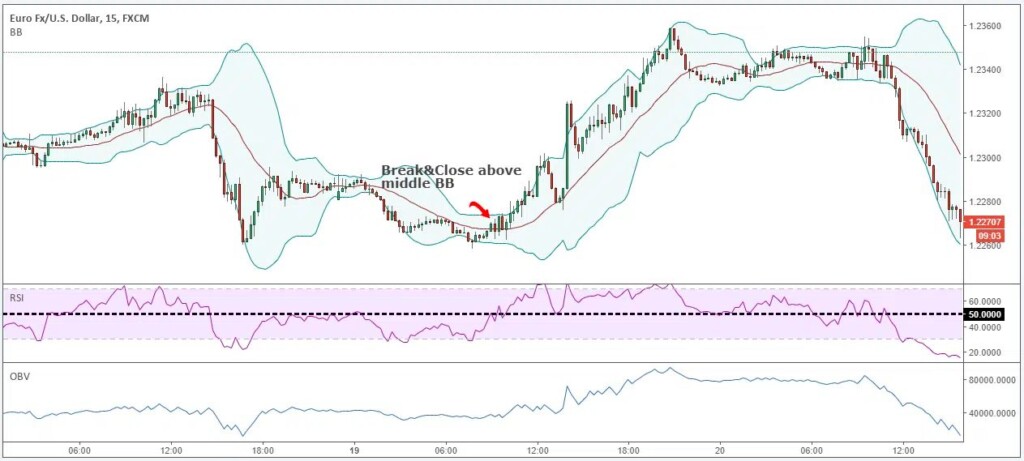
Bollinger Bands is one of the best trend-following indicators that measures the volatility of any market. Your chart setup should look like the chart above once you use all these indicators.
Let’s cut to the chase and see how you can trade efficiently using multiple technical indicators and consistently get profits smartly.
Trader’s level test
Answer 7 short questions and define your level as a trader. Take the test now to evaluate your real knowledge!
Start test

Trading using a multi-indicator strategy

Use three technical indicators to trade effectively. These indicators are Relative Strength Index, On Balance Volume, and Bollinger Bands. Together, they consider the momentum, trend, and volume aspects of trading which all traders need to pay close attention to.
For this article, we will look at the buy side.
Note! This strategy may be used on any time frame, so apply it to your preferred time frame.
Step #1: Find a price that breaks and closes above the middle Bollinger Band
The first trade confirmation we require is for the price to close and break above the middle Bollinger Band. Once this trade condition is met, we can use other indicators to confirm the signal.
Step #2: Wait for RSI should go over the 50 level
In this step, we must agree between the Bollinger Bands and the RSI’s price reading. The breakout can be confirmed if there is momentum behind the move.
Typically, an RSI reading of over the 50 level is considered positive momentum, while an RSI reading lower than the 50 level is considered negative momentum.
Note! The RSI will not break above the 50 level at the same time that the price breaks the middle BB. Sometimes we need to wait longer until bullish momentum appears.
Step #3: Wait for the OBV to rise
Again, the last condition for opening a trade is easy to understand. For this purpose, we seek evidence that the transaction we want to make has real buying power. We can see that the real volume shows up later. It’s crucial to be patient and wait for the perfect trade conditions to be completely satisfied before entering a trade and pressing UP (the price will increase).
The above is an example of a UP trade using multiple technical indicators. You can use the same rules for a DOWN trade but with the criteria in reverse.
The bottom line
You must invest time and effort to understand each technical indicator. No indicator guarantees 100% positive results, so don’t try to chase fairy tales. No one can ever predict the market with certainty.
However, if you follow this combination of technical indicators, you can increase the efficiency of your trading. Remember that all indicators are based on past prices, so only a multi-indicator strategy can help you predict what might happen next.
Trading with up to 90% profit
<span>Like</span>