Bollinger Bands are one of the most famous technical indicators used in trading. Below we will analyze what it is and how to use the indicator using the Bollinger Breakdown trading strategy as an example.
Start from $10, earn to $1000
What are Bollinger Bands?
Bollinger Bands are one of the most popular indicators used in trading. Essentially, it is a set of trend lines plotted on two standard deviations (+ and -) from a simple moving average of an asset’s price.
Bollinger Bands are usually plotted as three lines:
- Upper;
- Middle;
- Lower.
The middle line of the indicator is a simple moving average (SMA). The upper and lower lines are two standard deviations above and below the SMA.
The usual approach when using Bollinger Bands is to determine whether the market is overbought or oversold. Consider below the Bollinger Bounce and Bollinger Squeeze strategies to help investors get the right signals.
Bollinger Bounce
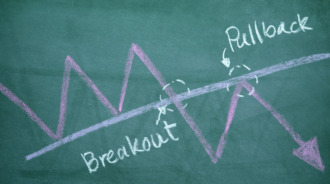
Bollinger Bands are designed to detect signals that help investors determine when an asset is oversold or overbought. There are two rules for trading Bollinger Bands. After a bounce from the upper or lower Bollinger Band, the price of an asset tends to return to the middle one. On the other hand, when the price of an asset breaks through the upper band, the market is overbought and expects a pullback.
When the price of an asset breaks through the lower Bollinger Band, the price of the asset has dropped too much and should bounce back.
Note! A breakout is not a trading signal. It does not give clues as to the direction and extent of future price movement.
Bollinger Squeeze

Squeeze is a sign that can be seen when the bands converge, narrowing the moving average. It signals a period of low volatility. Traders know a squeeze as a potential sign of higher volatility ahead.
But a squeeze is not a trading signal! The bands do not indicate when the change will occur or in which direction the price will move.
Note! The squeeze occurs when volatility falls to low levels and the Bollinger Bands narrow.
Effective strategies in your mailbox
Subscribe and discover a fund of trading knowledge
Great! Please check your email
We’ve sent you an email to confirm your subscription
Something went wrong
Try reloading the page. If that doesn’t help, please try again later
How to use Bollinger Bands for trading?
Bollinger Bands are used to assess the volatility of a market. This handy financial tool shows us whether the market is quiet or bustling. When the market is calm, the bands constrict; when the market is active, the bands expand.
The indicator is notable for the fact that price tends to return to the center of the bands. The position of the bands shows how strong the trend is and its potential high and low price levels that can be expected soon.
Consider how to use Bollinger Bands to trade options or other assets.
Day trading uptrends with Bollinger Bands
The indicator gives stakeholders crucial advice: An increase in the width of the Bollinger Bands channels precedes price swings. Overall, the width of the Bollinger Bands channels grows as the price fluctuates dramatically.
For example, an uptrend that reaches the upper band indicates that the price of an asset is rising, and you can take advantage of this opportunity to make a buying decision.
The price in an uptrend should not touch the lower band. If it happened, then this indicates a reversal.
Day trading downtrends with Bollinger Bands
Bollinger Bands are also used to determine how much an asset falls and when it might reverse to an uptrend. In a downtrend, the price moves along the lower band. If the price does not touch it, this is a sign that the downtrend is losing momentum.
The price should not break above the upper band, as this would indicate that the trend may reverse or slow down.
Limitations of Bollinger Bands
Bollinger Bands provide traders with information about price volatility. They are best used with two or three uncorrelated indicators that give more direct market signals. It is essential to use indicators based on different types of data. For example, technical methods such as Moving Average Divergence/Convergence (MACD), on-balance volume, and Relative Strength Index (RSI) can be used.
Earn profit in 1 minute
Because they are based on SMA, old price data is weighted the same as the most recent price data. Therefore, new information can be diluted with outdated data. Because of this, you should adjust and monitor your SMA and standard deviation assumptions.
5 of the best scalping indicators to use right away
You can experiment with various indicators, but there are some you can use right away to build your best scalping strategy.
Read more

Bollinger Breakdown trading strategy
One of the most popular trading strategies used by beginners is Bollinger Breakdown. It consists in carefully studying the chart using the Bollinger Bands indicator and looking for signals to make a trade.
Periodically on the chart, you can see flat periods when the price remains approximately at the same level. It is a sign that the quotes will go up or down.
Let’s take a step-by-step look at how to use this trading strategy with Bollinger Bands:
- Select and customize the Bollinger Bands indicator.
- Find a channel on the chart where the price of the asset practically does not change.
- Examine the data: if the Bollinger Bands diverge for a significant distance, the price is actively rising or falling. If they narrow (approach each other), the price change slows down, and a flat begins.
- Your task is to wait until the Bollinger bands narrow and the flat begins.
- If the price goes beyond the upper or lower line of the indicator, we open a deal in the direction of a new asset price movement. It is in this direction that he will move soon.
Focus on the time frame when setting the expiration period. The longer it is, the more you need to increase the expiration time. For instance, if you set the timeframe to 15 seconds, the optimal expiration time would be 5 minutes.
Note! To better understand how to use the strategy in trading, we recommend you test it on a demo account.
Conclusion
To get a positive trading result using the Bollinger Bands indicator, it is essential to know it well. If you learn to see what the Bollinger Bands squeeze and bounce are telling you, you will be able to understand in time how the price will conduct. But remember that no indicator can give a 100% signal as the market is volatile.
Trading with up to 90% profit
<span>Like</span>