
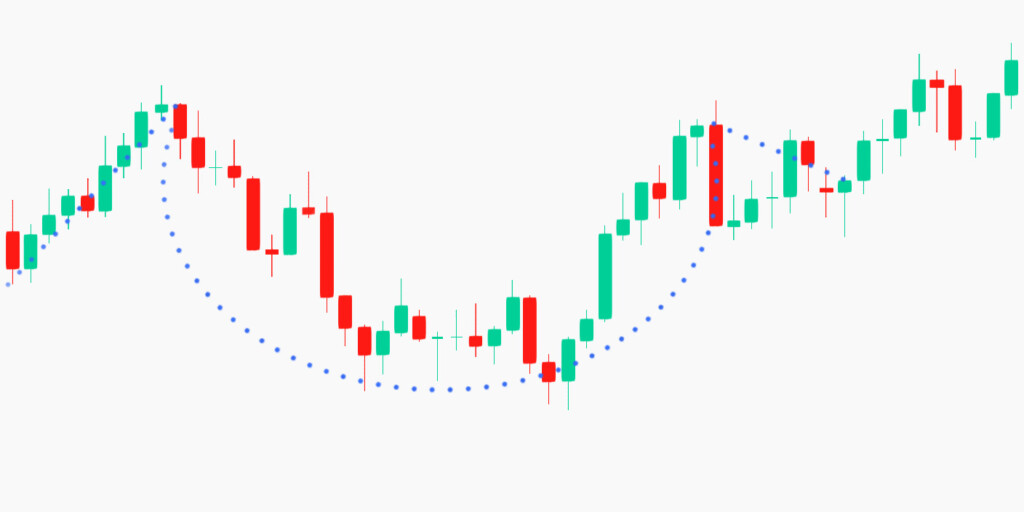
The cup and handle price pattern is adopted as a popular trading strategy by many professional traders. It is the price pattern represented on the chart, which can be a powerful risk control indicator. The cup and handle price pattern is similar to a cup with a handle, where the pattern forms a “u” shape with a handle that is slightly drifting downward.
This trading pattern is considered to be a bullish signal with the right-hand side of the cup and handle pattern experiencing lower trading volume. The cup and handle pattern may be formed on the price chart as long as 65 weeks or as short as seven weeks.The cup and handle rule and how it suggests a trading strategy?
We have established earlier, how the cup and handle pattern is a technical indicator where the movement of an asset’s price mimics that of a cup which is followed by a downward trend. It is important to know how this trading pattern can help investors and professional traders to make the best trading decisions.
To start with, the cup and handle pattern signals a strong opportunity to go long on an asset. Usually, when this part of the price pattern is completed the assets may reverse course and attend new highs. The formation of the cup and handle pattern typically falls between a space of seven weeks to a year.
Earn profit in 1 minute
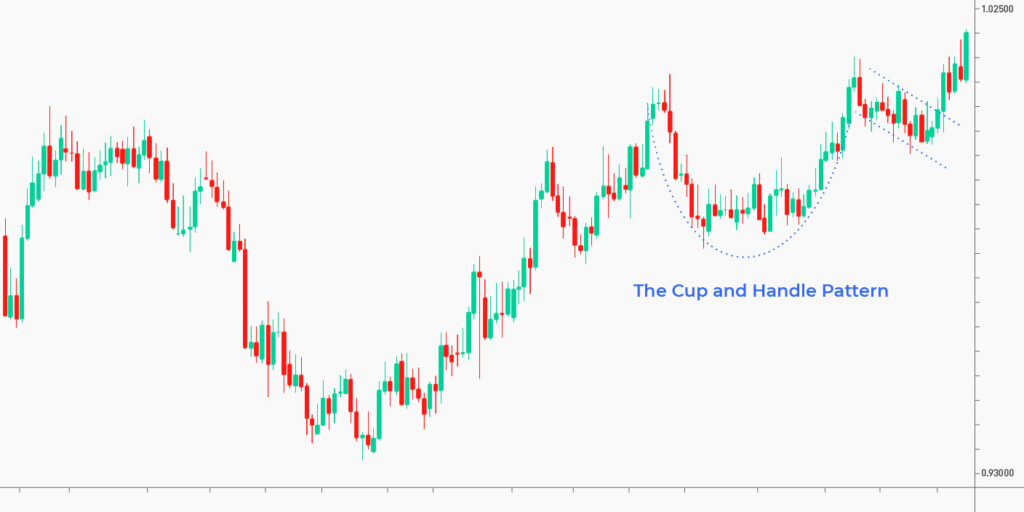
How to spot the cup and handle pattern during trading

The first step to manage your trading risk with the cup and handle pattern is to know how you can identify them in any given market situation.
The steps highlighted below will help you to identify the cup and handle pattern without breaking a sweat:
Step 1. The cup and handle price pattern should form more of a U-shape rather than the v shape. Also, the high points on both sides of the cup should be approximately even
Step 2. The handle of this price pattern looks similar to a consolidation in the form of a pennant or flag pattern.
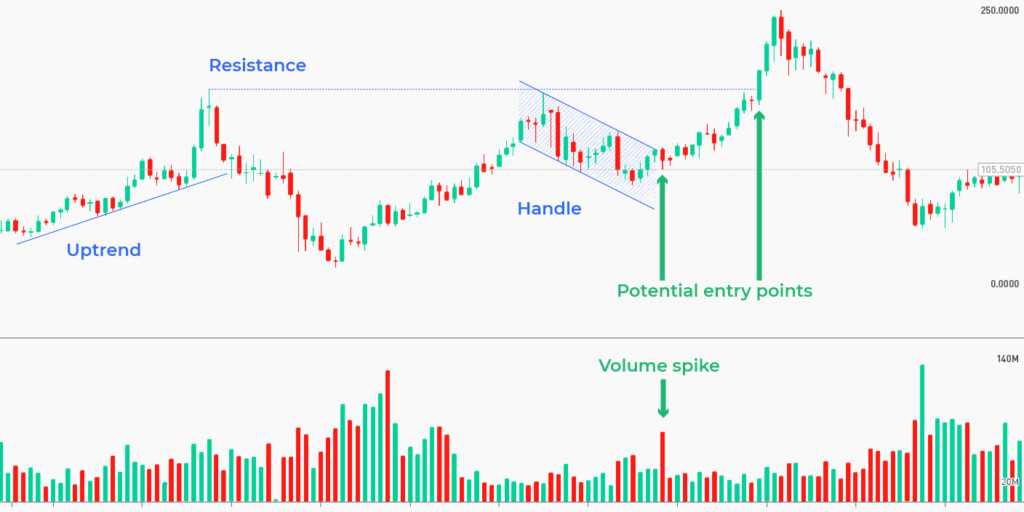
Step 3. The breakout signal can be represented in different ways depending on the preference and experience of the trader. Some professional traders take a look at the resistance levels between the highs of the cup.
Once there is a breakout at this level, an entry point will be confirmed. On the other hand, some traders use a break of the handle trendline as an entry point to go long.
Effective strategies in your mailbox
Subscribe and discover a fund of trading knowledge
Great! Please check your email
We’ve sent you an email to confirm your subscription
Something went wrong
Try reloading the page. If that doesn’t help, please try again later
Risk control trading with the cup and handle pattern
Risk control trading with the cup and handle strategy comes in various ways when dealing with equities and the foreign exchange market.
If trend riding is not your forte, then one of the effective ways to trade with the cup and handle strategy while reducing your risk level is to capture a swing. What does this mean? Capturing a swing simply means that you are capturing one move in the market
As usual, you step out of the trade before there is opposing pressure.
Take for example, if you’re trading long on an underlying asset, you want to step out of the trade right before there is a resistance or swing high. Similarly, if you are trading short, you want to exit the trade right before there is support or a swing low.
For the cup and handle chart pattern, all you need to do is identify the distance between the high and the low of the cup, then project the distance from the breakout level which is the target profit of your cup and handle pattern.
7 golden rules of trading
Everyone has their own trading style, but some principles are critical for success. Make sure you’re following these basic rules of trading.
Read more

Mistakes to avoid when trading with cup and handle strategy
You must first understand that the price must approach the resistance level and then form a consolidation or what is preferably called a buildup for the handle of the pattern to form. At this point, many traders think to themselves that it is time to go short since there is air resistance in view.

This is fine if the price gets rejected strongly at the resistance level as it builds up momentum. On the contrary, if the price approaches a resistance level then it forms a build-up. If it makes higher lows into resistance then you should be careful when making a decision.
What this is telling you is that there are traders willing to make a move at these high prices. The last thing you want to do at this point is to short the market because there is a high chance of a breakout.
Conclusion
The cup and handle pattern is an invaluable trading asset that every investor should be aware of. The good thing about this is that you can deploy the pattern as a part of your strategy whether you’re a novice or a pro.
Sources:
— Trading with Rayner: Cup and Handle Pattern Trading Strategy Guide
— Daily FX: Trading with the Cup and Handle Pattern
— Investopedia: Cup and Handle Pattern: How to Trade and Target with an Example
Trading with up to 90% profit
+1 <span>Like</span>