Finding a reliable strategy for trading requires time and effort. Without working techniques, you may be disappointed and think that trading is not meant for you. In this article, we discuss the central pivot range (CPR), an indicator you can apply in creating a trading strategy to earn extra income.
Trading with up to 90% profit
What is the central pivot range?
The central pivot range (CPR) indicator is a technical analysis tool used to detect probable support and resistance levels in a financial asset’s price. It is based on the premise that an asset’s price tends to oscillate around a central pivot point, which is computed using the asset’s high, low, and close values from the previous trading period.
The upper and lower pivot points are then calculated using the central pivot point to determine the central pivot range. On a chart, CPR is commonly shown as a horizontal line with the central pivot point in the center and the upper and lower pivot points at either end.
Traders can use the CPR indicator to discover probable market entry and exit opportunities, as well as to assess the asset’s overall direction and strength. Some traders may also combine CPR with other technical indicators to confirm signals and increase trade accuracy.
Effective strategies in your mailbox
Subscribe and discover a fund of trading knowledge
Great! Please check your email
We’ve sent you an email to confirm your subscription
Something went wrong
Try reloading the page. If that doesn’t help, please try again later
Identifying trends using CPR
Identifying trends in a chart using the central pivot range can be a very helpful trading guide. Below are the main trends to check.
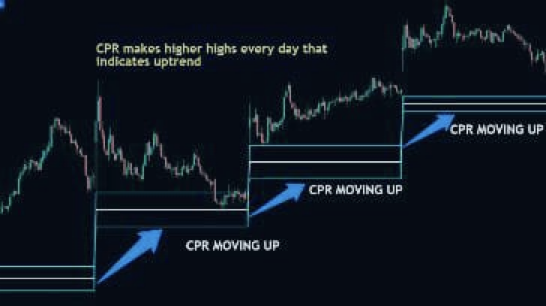
Uptrend

When CPR in a chart shows higher highs, or in other words, the current period CPR is higher than the former period one (depending on your trading period – daily, weekly, or monthly), the stock is in an uptrend. The market is bullish, and it is an opportunity to buy.
Downtrend
A downtrend is precisely the opposite of an uptrend. If CPR shows lower lows or the former CPR is lower than the current one for the day, week, or month, then that is a downtrend. What are you supposed to do in this case? Look for a selling opportunity because this is a bearish market.

Sideways trend
A sideways trend is a situation whereby CPR on the chart alternates the upward and downward movements. It, therefore, means that the market is trendless. In this case, a novice trader may not make a correct shot because of a higher possibility of stop loss.
CPR-based trading strategies
Though many people associate CPR-based strategies with intraday trading, it is important to note that you can apply it to other styles, such as swing, and still carry out correct forecasts. Let us see below some of the techniques you can take advantage of.
Start from $10, earn to $1000
1. Using virgin CPR
A virgin CPR always occurs when the security’s price fails to cross any line of CPR. According to most observations, if the asset’s price does not touch the previous day’s range, the probability that it fails to break the CPR range is 40%.
Hence, virgin CPR forms solid support and resistance levels. What you will need to do is to first mark assets or instruments for the upcoming sessions whenever you see a virgin CPR. You might observe a significant reversal when the price reaches that virgin CPR level.
2. When the price breaks the CPR range
In case the trading stock breaks either line – the Top CPR (TC) or Bottom CPR (BC), it is referred to as a CPR breakout. This condition suggests a strong likelihood that the current trend will last for some time.
So, what can you do in this case? When you see the asset’s price above the TC, the market is bullish, hence an excellent opportunity to buy as CPR works as the support level. On the other hand, when the price is below BC, there is some element of bearishness in the market. In this case, the CPR indicator acts as resistance, and you should find an opportunity to sell.
3. Price action within CPR

The current price trading in between CPR suggests that the market is in accumulation, hence sideways moves. One of the options is to take advantage of the volume to wait for CPR to break through above the TC and (if the range is quite wide) buy at the BC, though your target should be the TC.
4. Tracking width of CPR
Once you identify CPR on the chart, getting its width may not be challenging. The width can serve as an essential aspect of understanding the market trend, though only for short-term price movements. Hence, CPR is well-suited for intraday trading and swing strategies.
The width comes in three different forms, which we will discuss below.
Narrow range
When the chart shows a narrow range CPR, it implies that the asset was trading within a small range the day before if you are using the daily CPR. It might also be a week or month before if the CPR you are applying for is for the week or month ended.
Here is how you can utilize the narrow CPR trading strategy. When you compare the previous day’s, week or month’s CPR with the current one, you will often notice that the current one is narrower compared to the previous one – this indicates a higher probability of a trending day.
Medium CPR
When the distance between TC and BC lies between the narrow and wide margins of CPR, its width is medium. Therefore, the asset will not be as trending as in the case of a narrow CPR.
Wide range CPR
A wide range of CPR occurs when there is a significant margin between the TC and the BC. This situation indicates that the asset was trending in the previous period. It also suggests that the current period CPR will be a wide range; hence you can expect a sideways market.

5. Look for trade setups near the support and resistance
Place a buy order near a support level and a stop loss below the support level. You can also place a sell order near a resistance level and a stop loss above the resistance level.
6. Engage other indicators
Consider using other technical indicators, such as moving averages or the relative strength index (RSI), to confirm signals and to help identify the appropriate stop loss and take profit levels.
Cryptocurrencies: what to expect in 2023
2023 is expected to be the year of recovery for the crypto market. Read on to see what to expect in 2023 for cryptocurrencies.
Read more

The difference between pivot points and central pivot range
Pivot points are a technical analysis tool used to determine the market’s overall trend over various timeframes. They are calculated using a specific time’s high, low, and close price and can be used to identify potential support and resistance levels for the current or upcoming period.

The central pivot range (CPR) is a type of pivot point that calculates it by taking the average of the high, low, and close prices over a given time. CPR is then calculated as a range around the pivot point, with the range equal to half of the security’s average true range over a given period. CPR, like pivot points, can be used to identify probable support and resistance levels in the market.
Another notable difference is the inclusion of TC and BC in the calculation of CPR, which is not seen in pivot points.
Calculation of CPR
Though online calculators exist, you can manually calculate CPR of any security you are trading. To calculate the central pivot range, you need to use three key pieces of information: the high price, the low price, and the closing price of a security for a given period.
Here are formulas to apply for different calculations:
Pivot point (PP) = {High (H) + Low (L) + Close (C)} / 3
Bottom central pivot point (BCPP) = {High (H) + Low (L)} / 2
Top central pivot point (TCPP) = (PP – BC) + PP
Benefits of trading strategy with CPR
Using a central pivot range (CPR) is a good trading strategy because of the benefits the indicator offers. Here are some of them to note:
- It is straightforward to follow.
Compared to most technical analyses, CPR is ranked among the most straightforward tools for novices and experts to follow while trading. It gives an overview of how security is trending – upwards, downwards, or range-bound.
- It offers strong support and resistance.
Most professionals use CPR in intraday trading due to its strong support and resistance levels, allowing for finding the exit or entry points.
- It helps manage risk.
By using CPR to set appropriate stop-loss orders, traders can limit potential losses on a given trade.
- It can be used with other technical tools.
CPR can be used in conjunction with other indicators, such as moving averages or the relative strength index (RSI), to provide a more comprehensive view of market conditions.
Note! Despite all of the above, no strategy with CPR can guarantee 100% success in your trading.
FAQs
To finally understand the topic, let’s answer the frequently asked questions about the indicator.
How effective is CPR for trading?
Some use CPR to identify entry and exit points for their trades, while others apply it in conjunction with other tools to confirm trading signals. It is important to note that no single indicator is effective in all market conditions, and using a combination of tools and strategies is vital when making trading decisions.
Is there a specific timeframe for CPR?

CPR is most commonly employed and has the highest accuracy in intraday trading. However, it may also be used to analyze daily and weekly charts and long-term investments in stocks.
CPR is typically calculated at a higher timeframe than that used for trading. For example, if you intend to trade daily, CPR should be computed using a weekly timeframe, whereas if you trade weekly, it would be best to calculate CPR using a monthly timescale.
Where to find more about CPR-based trading strategies?
To become an expert, equip yourself with information from multiple trusted sources and trade based on knowledge. You can find guides and books on CPR trading strategies in PDF or PPT format. Youtube videos are also helpful in your in-depth studies of the indicator.
The bottom line
The trading strategy with CPR is one of the best that intraday traders can utilize. It allows for identifying the bullish or bearish trend and taking appropriate trading positions.
Note that you can lose funds while trading. Remember to use proper risk management techniques, such as limiting investment in one trade to a small percentage of your account balance.
Earn profit in 1 minute
<span>Like</span>