

It’s an exciting task to look for patterns on a price chart. You will learn many of them with time. However, there are some you should know at the beginning of your trading path.
According to several studies, rectangle, triangle, and flag patterns are very accurate. Their success rate exceeds 70% on average.
It’s vital to understand that success depends not on a pattern itself but on a trader’s skills. Keep reading to improve your expertise in the three best continuation patterns.
Trading with up to 90% profit
Chart patterns: types
There are three pattern types: reversal, continuation, and bilateral.
- Reversal patterns signal a price reversal.
- Continuation patterns forecast a continuation of a primary trend. They appear when buyers and sellers need to evaluate market conditions and decide whether the trend can keep moving in the same direction.
- Bilateral patterns can predict both a reversal and a continuation. Their signals depend on market conditions.
Below, you will find the top three continuation patterns that will inform you if a trend is continuing.
Effective strategies in your mailbox
Subscribe and discover a fund of trading knowledge
Great! Please check your email
We’ve sent you an email to confirm your subscription
Something went wrong
Try reloading the page. If that doesn’t help, please try again later
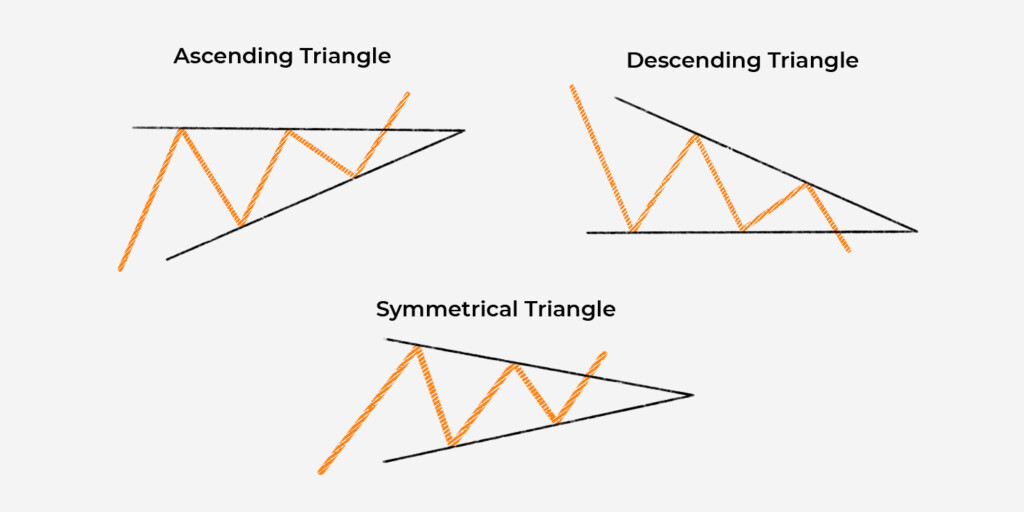
Triangles
The pattern is presented by three triangles: ascending, descending, and symmetrical. But the latter is bilateral.
A triangle’s duration depends on a timeframe, but there should be at least two swing highs and two swing lows.
Ascending triangle
An ascending triangle is a bullish pattern. A price forms higher lows, but its highs are almost equal (strong resistance). When lows are too close to the resistance, a breakout continues the uptrend.
Descending triangle
A descending triangle is a bearish pattern. A price forms lower highs, but its lows are almost at the same level (strong support). When highs are too close to the support level, a breakout continues the downtrend.
Symmetrical triangle

A symmetrical triangle can be both a continuation and a reversal pattern. A price forms lower highs and higher lows, but the market sentiment decides on the breakout’s direction.
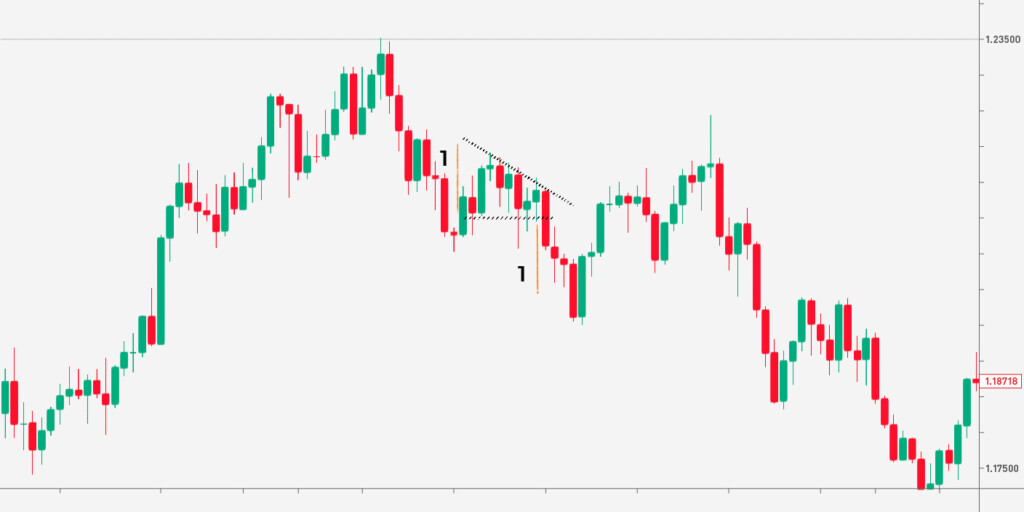
To trade the triangle pattern, you should open a position in the direction of the breakout. For instance, if there is an ascending triangle, you should wait for the price to break above the resistance and buy.
A take-profit target should equal the widest part of the triangle (1). A stop-loss order can be calculated with the risk-reward ratio. Your potential profit should be at least twice as big as the possible loss.
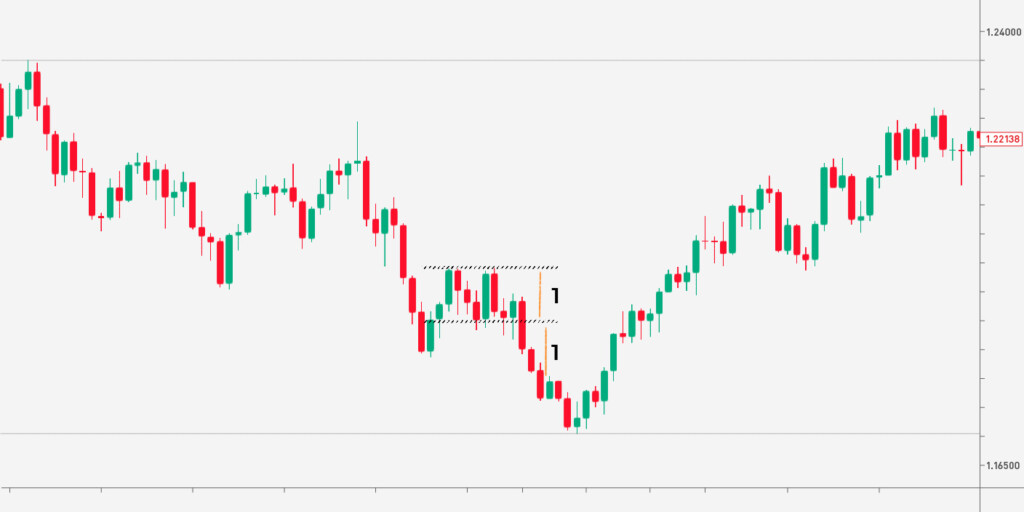
Rectangles
A rectangle is the simplest pattern. It appears when a price moves horizontally within a narrow range. The only difference between bullish and bearish rectangles is the trend in which they appear. A bullish rectangle occurs in an uptrend, while a bearish rectangle appears in a downtrend.
Start from $10, earn to $1000
After a rectangle pattern appears, open a trade in a breakout direction. A take-profit level should equal the width of the rectangle (1). A stop-loss size will depend on the take-profit distance. Choose a 1:2 or 1:3 risk/reward ratio.
Trader’s level test
Answer 7 short questions and define your level as a trader. Take the test now to evaluate your real knowledge!
Start test

Flags
Flags are angled rectangles. When a price moves within a falling rectangle, it’s a bullish signal. The pattern is called a bull flag. When a price is in a rising rectangle, it’s a bearish signal. The pattern is called a bear flag.
Open a trade in a breakout direction. A take-profit level can be based on the distance between flag boundaries (1) or the length of its flagpole (2). A flagpole is the distance the price goes before the flag is formed. The first approach is conservative so that it can be used in highly volatile markets. The second approach suits stable markets, as it’s much riskier.
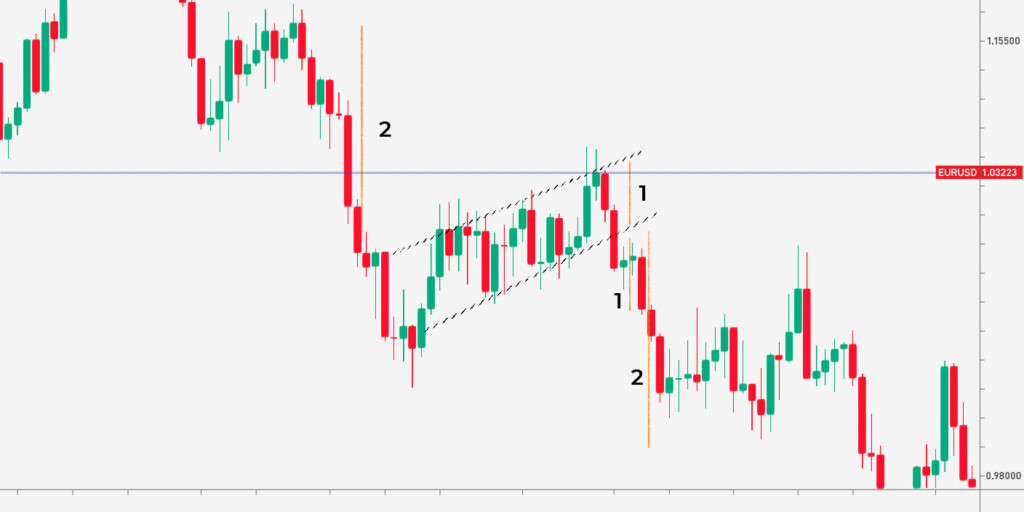
A stop-loss level will depend on a take-profit size. Again, the risk-reward ratio will serve you. In the conservative approach, you can use a 1:2 ratio, while for the riskier one, you better increase potential profits and implement a 1:3 ratio.
Takeaway
Continuation patterns constantly occur on price charts. They provide accurate entry and exit points. Although they seem simple, you should practice using them before trading on a real market.
Earn profit in 1 minute
<span>Like</span>