

Entry and exit points are cornerstones of any trading strategy. Many newbies focus on exit points because they believe only a successful trade closure can bring rewards. However, an effective entry point is also vital.
According to statistics, less than 10% of traders succeed. This is because of their unwillingness to learn how to trade.
Below you will find three effective indicators to identify an entry point at the early stages.
Trading with up to 90% profit
1. Alligator
The Alligator indicator is one of the indicators created by Bill Williams, a famous trader and one of the pioneers of market psychology theory. Have you heard about the Awesome Oscillator and Market Facilitation Index? He developed them as well.
The Alligator indicator consists of three smoothed moving averages (SMMA) shifted forward by a particular number of bars that follow the trend: when the three lines are entwined, the price consolidates; as soon as the market enters a strong trend, the lines diverge.
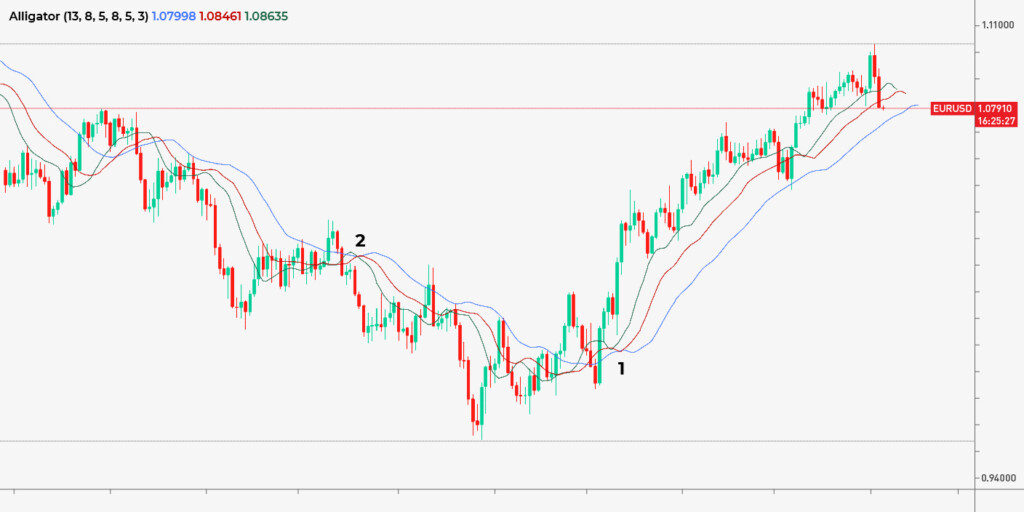
Once the fastest SMMA breaks above other moving averages, it’s a buy signal (1), as the Alligator tells a trader the price will move in an uptrend. Once the fastest SMMA falls below other moving averages, it’s a sell signal (2), as the indicator informs a trader the price will move in a downtrend.
Effective strategies in your mailbox
Subscribe and discover a fund of trading knowledge
Great! Please check your email
We’ve sent you an email to confirm your subscription
Something went wrong
Try reloading the page. If that doesn’t help, please try again later
2. Stochastic oscillator
A stochastic oscillator is a momentum indicator that measures price strength. It consists of two lines moving within the 0-100 range.
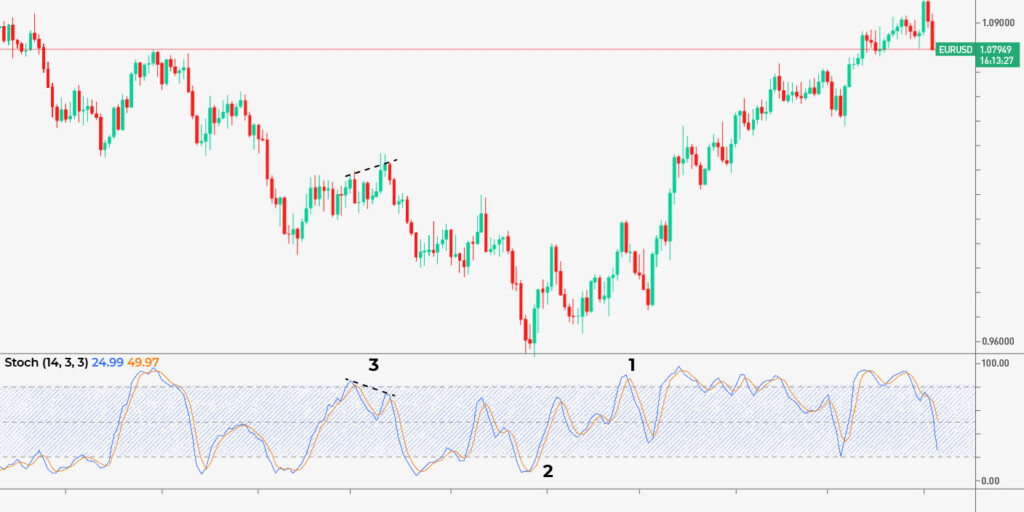

The indicator provides three entry signals:
- Crossovers. The indicator has two lines – %K and %D. When %K falls below %D, it’s a sell signal (1). Conversely, it’s a buy signal when %K rises above %D. The signal is stronger in overbought and oversold areas, respectively.
- Overbought/oversold conditions. When the oscillator stays above 80, the asset is overbought. Thus, the price is expected to decline as soon as the stochastic moves below 80. When the oscillator is below 20, the asset is oversold. The price is expected to rise as soon as the indicator rises above 20 (2).
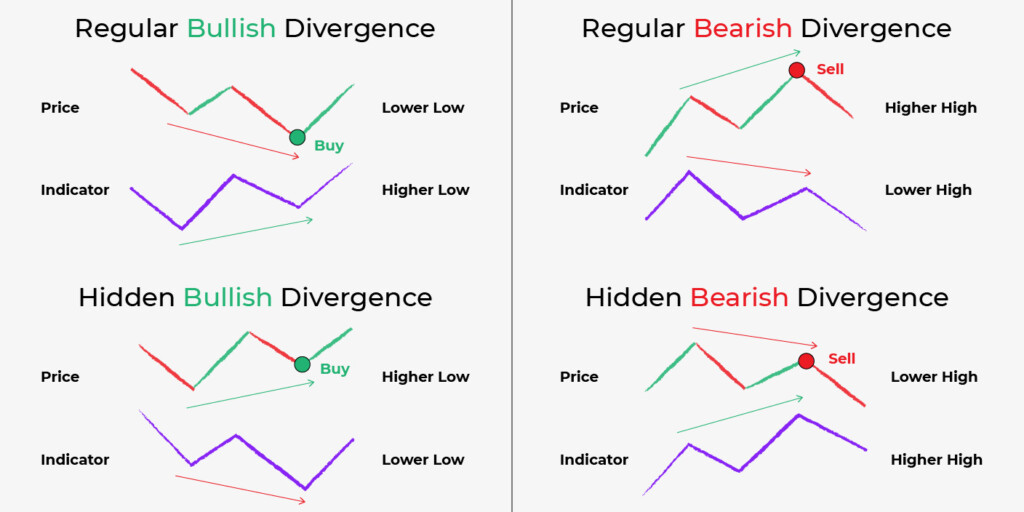
- Divergence. There are four divergence types. You can examine them in the graph below (3).
Trader’s level test
Answer 7 short questions and define your level as a trader. Take the test now to evaluate your real knowledge!
Start test

3. Relative strength index (RSI)
The relative strength index is often compared to the stochastic oscillator. Actually, they are both momentum indicators that provide similar signals except for crossovers. Still, they are calculated differently. Therefore, they provide different signals.
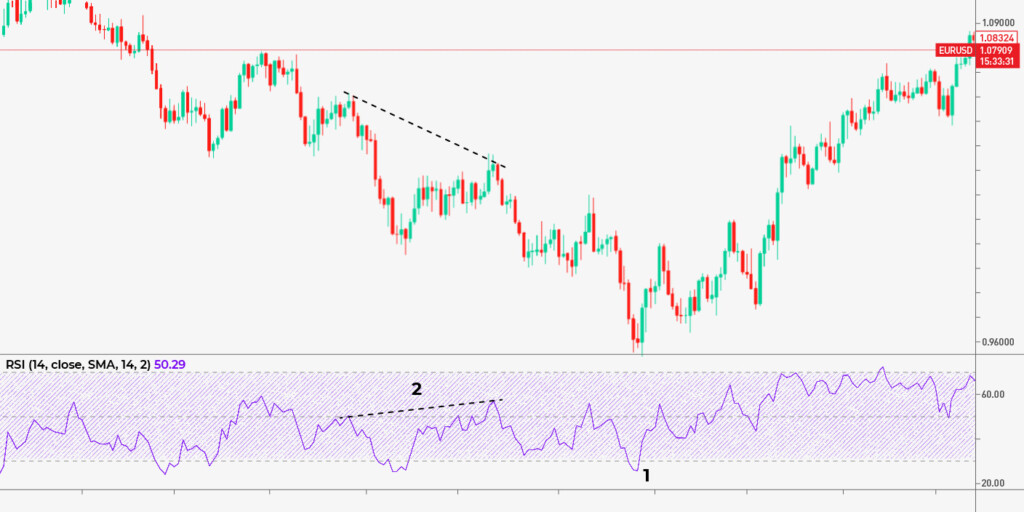
The RSI consists of a single line that moves within a 0-100 range. Its primary signals are:
- Overbought/oversold conditions. When the indicator stays above 70, the market is overbought, and traders expect the price to decline soon. When the RSI falls below 70, it’s a sell signal. When the indicator is below 30, the market is oversold, and the price is expected to increase soon. A rise of the RSI above 30 is considered a buy signal (1).
- Divergence. Divergence signals are the same as for the stochastic oscillator (2).

Final thoughts
You can use the mentioned above indicators to find not only reliable entries but effective exit points. Learn more about them and practice to determine how these tools can help you exit the market at the best possible levels. However, you should remember that there is no perfect indicator, and any of them can provide wrong alerts. Therefore, you should always combine signals of 2-3 technical analysis tools to identify entry and exit points.
Sources:
What Is the Williams Alligator Indicator and How Do You Trade It?, Investopedia
Relative Strength Index (RSI), CFI
Start from $10, earn to $1000
<span>Like</span>